Saturday, July 2, 2016

4Mix Ancients for PuntK12 Calculator

Overview

4Mix is a nifty supplementary tool executed alongside GEDMatch calculator or ADMIXTURE outputs to establish the genetic distance and ancestral proportions of a given number of population combinations. Originally conceived by "DESEUK1" (Eurogenes Ancestry Project participant),  it has been implemented numerous times across the wider genetic genealogy community.

In light of Lazaridis et al. 2016's recent "The genetic structure of the world's first farmers" [Link], crucial aDNA from the Near-East has been published and utilised by citizen scientists.

This brief entry provides users with an immediate means of assessing their ancestral proportions with the new releases through the PuntDNAL K12 calculator.

The R script, an example target file, the population source data and ReadMe's (DESEUK1's original and my own contribution outlining the "sink" version's procedure) can be found in the link below:


Purpose of the Package

This modification was simply designed to give the wider genetic genealogy community an easy and informal means of manipulating this recent data to explore ethnogenesis or personal ancestries at their own discretion. This is not a formal assessment of the above.

Limitations

Those intending to use this 4Mix package must be aware of the following:

1) The Iran_N, Iran_ChL and Levant_N samples here are GEDMatch contributions by genome bloggers "Kurd" and "Srkz". These currently number one, two and one respectively.

2) The utilisation of these samples as references is a short-term convenience and should not be considered equivalent to ADMIXTURE runs containing these samples among them. The methodology described above opens the potential for Davidski's "Calculator Effect" to manifest.

3) Due to the continued absence of Ancestral South Indian (ASI) aDNA, the Paniya were considered a "last resort" surrogate to address the ancestral proportions South/South-Central Asian samples would generate. Furthermore, additional modern reference populations (i.e. Yoruba, Nganasan) were used to furnish other worldwide aDNA deficiencies. These populations were chosen based on their peak modal status in the K's determined by the PuntDNAL K12 calculator.

Contributions

A very special thank you to the users "jesus" and "khanabadoshi" from Anthrogenica for their guidance and assistance in modifying the package for your usage. Another extended thank you to the user "surbakhunWessste" (also from Anthrogenica) for outlining the "sink" procedure here

Saturday, March 19, 2016

Identifying Bias in Cohorts: IBD and Life Stage Effect [Review]

A very interesting paper published barely one week ago investigating the potential for bias exertion in population genetics cohorts:

Reducing bias in population and landscape genetic inferences: the effects of sampling related individuals and multiple life stages.
Peterman W1, Brocato ER2, Semlitsch RD2, Eggert LS2.
PeerJ. 2016 Mar 14;4:e1813. doi: 10.7717/peerj.1813. eCollection 2016.

"In population or landscape genetics studies, an unbiased sampling scheme is essential for generating accurate results, but logistics may lead to deviations from the sample design. Such deviations may come in the form of sampling multiple life stages. Presently, it is largely unknown what effect sampling different life stages can have on population or landscape genetic inference, or how mixing life stages can affect the parameters being measured. Additionally, the removal of siblings from a data set is considered best-practice, but direct comparisons of inferences made with and without siblings are limited. In this study, we sampled embryos, larvae, and adult Ambystoma maculatum from five ponds in Missouri, and analyzed them at 15 microsatellite loci. We calculated allelic richness, heterozygosity and effective population sizes for each life stage at each pond and tested for genetic differentiation (F ST and D C ) and isolation-by-distance (IBD) among ponds. We tested for differences in each of these measures between life stages, and in a pooled population of all life stages. All calculations were done with and without sibling pairs to assess the effect of sibling removal. We also assessed the effect of reducing the number of microsatellites used to make inference. No statistically significant differences were found among ponds or life stages for any of the population genetic measures, but patterns of IBD differed among life stages. There was significant IBD when using adult samples, but tests using embryos, larvae, or a combination of the three life stages were not significant. We found that increasing the ratio of larval or embryo samples in the analysis of genetic distance weakened the IBD relationship, and when using D C , the IBD was no longer significant when larvae and embryos exceeded 60% of the population sample. Further, power to detect an IBD relationship was reduced when fewer microsatellites were used in the analysis."
[Abstract]

How relevant is the above to human population genetics? Quite, for two reasons:
  1. Per the accepted phenomenon which props the IBD model, the study does give a unique angle with respect to sampling methods. The difference in IBD status as determined by life stage, alongside statistical demonstration of insignificance once only A. maculatum larvae and embryos were considered, confirms social mobility plays a role in obscuring intra-species IBD measurements. This is clearly mitigated in human settlements with extreme geographical isolation.
  2. More microsatellite markers are usually better - Genetic genealogists or researchers familiar with Y-chromosomal analyses are already aware of this mantra. Not a surprise to see the authors concluded their statistical power increased when the maximum number of markers were employed.
The abstract, rather unhelpfully, does not reveal the outcomes of the sibling-pair variation to their experimentation. 

A full read of the paper at some point should hopefully address the above, as well as the raw data produced through the statistical calculations.

Wednesday, September 23, 2015

Pain: OPRM1 & The Ancestral Contribution [Review]

A paper by Soto & Catanesi assessing genetic variation in the μ (mu) opioid receptor gene (OPRM1) was published in May 2015. OPRM1 contributes to the structure of the μ opioid receptor (MOR), one of three major opioid receptor types which broadly contribute to pain sensation, addiction, ion influx into cells and a host of other functions [1]. 

WHO Pain Ladder (courtesy of paineurope.com)
Opioid receptors are of interest to medical researchers due to the varying specificity of receptor agonism (activation) by conventional treatments (e.g. tramadol has a higher affinity to MORs than others [2]). Additionally, opioid receptor antagonists are widely used in pain management (as directed by the World Health Organisation's classic "pain management ladder", figure opposite [3]). As such, understanding the structure of opioid receptor characteristics between individuals could theoretically fine-tune the ideal pharmaceutical agents to be used in specific situations, such as in palliative or acute care, as well as narcotic or surgical rehabilitation (in effect stratified or personalised medicine).

Although the paper indicates contradiction in our current data regarding the most studied SNP to date (rs1799971, linked to the A118G polymorphism), others residing within or near OPRM1 are postulated to have an effect on MOR function.

OPRM1 from a population genetics perspective is of interest through the observation in numerous older studies (listed within paper) that show differing A118G polymorphism frequencies across various world populations. The authors extended these findings by including the HapMap world database with their own Argentinian samples to determine whether OPRM1 SNP variants correlated with ancestral background. Establishing the polymorphic frequency among Argentinians appears to be a secondary aim here.

The authors of this paper concluded that Sub-Saharan African, West and East Eurasian ancestral status coincides with OPRM1 polymorphism status in the several SNPs examined (through the use of Fst and AMOVA). However, they noted that no such clustering was observed between West Eurasians (Europeans) and American populations (mixed Argentinian and Mexican samples). This was taken to indicate extensive gene flow from European colonists had made a massive contribution to the polymorphic status at this gene. 

Another possibility not highlighted in the paper is that the native Amerindian population of pre-colonial America had similar OPRM1 polymorphic status as modern West Eurasians. In light of the recent findings supporting sizeable mutual prehistoric ancestry between these two populations through a conceptual "Ancestral North Eurasian" (ANE) component (Raghavan et al., see below) [4], the OPRM1 congruity between Amerind-European mixed modern Americans and Europeans could partially be attributed to the proposed ANE-containing migratory events. [4] 

Estimated Shared Drift Heat Map with MA1 (Raghavan et al.)


Overall, Soto & Catanesi provide us with a good summary of the population structure that can be directly observed through OPRM1 gene polymorphism variation and support earlier work indicating a correlation with ancestry. It would have furnished their discussion better had some exploration of recent developments in archaeogenetics been undertaken. Their assertion of complete OPRM1 SNP status replacement among Amerind-European admixed American individuals is of course possible, but no evidence is provided that categorically dismisses commonality between Europeans and Amerindians on this genomic region as at least partially responsible for the observation.

Human population genetic structure detected by pain-related mu opioid receptor gene polymorphisms.
López Soto EJ, Catanesi CI. Genet Mol Biol. 2015 May;38(2):152-5. doi: 10.1590/S1415-4757382220140299. Epub 2015 May 1.
"Several single nucleotide polymorphisms (SNPs) in the Mu Opioid Receptor gene (OPRM1) have been identified and associated with a wide variety of clinical phenotypes related both to pain sensitivity and analgesic requirements. The A118G and other potentially functional OPRM1 SNPs show significant differences in their allele distributions among populations. However, they have not been properly addressed in a population genetic analysis. Population stratification could lead to erroneous conclusions when they are not taken into account in association studies. The aim of our study was to analyze OPRM1 SNP variability by comparing population samples of the International Hap Map database and to analyze a new population sample from the city of Corrientes, Argentina. The results confirm that OPRM1 SNP variability differs among human populations and displays a clear ancestry genetic structure, with three population clusters: Africa, Asia, and Europe-America."


References
1. Feng Y, He X, Yang Y, Chao D, Lazarus LH, Xia Y. Current research on opioid receptor function. Curr Drug Targets. 2012 Feb;13(2):230-46.

2. Dayer P, Desmeules J, Collart L. [Pharmacology of tramadol]. Drugs. 1997;53 Suppl 2:18-24. [Article in French]

3. WHO | WHO's cancer pain ladder for adults. [Last Retrieved 22/09/2015]: http://www.who.int/cancer/palliative/painladder/en/ 

4. Raghavan M, Skoglund P, Graf KE, Metspalu M, Albrechtsen A. Upper Palaeolithic Siberian genome reveals dual ancestry of Native Americans. Nature. 2014 Jan 2;505(7481):87-91. doi: 10.1038/nature12736. Epub 2013 Nov 20.

Thursday, August 6, 2015

Steppe Ancestry Estimations in West, Central & South Asia (Ancestral Proportions Method) [Original Work]

Disclaimer
This is largely a re-post, albeit with additional explanations, from a recent ADMIXTURE autosomal run (Eurasia K20) performed at Anthrogenica by the user Kurd. Full technical information and the original files may be found in his original thread. Full acknowledgement is provided to him for the great work. Unless stated otherwise, assume the contents refer to the Eurasia K20 run. This entry may be updated at any time to include further investigations based on future runs. Finally, this entry assumes the mainstream Pontic-Caspian theory for the genesis of the Indo-Europeans to be fully accurate.

Preamble
This entry/repost contains a "quick and dirty" method for a preliminary attempt at deriving their Sintashta admixture levels in West, Central and South Asians based on the Eurasia K20 scores. Given the different admixture histories elsewhere in Eurasia, this probably won't be very informative for users with ancestral backgrounds outside the lands between Kurdistan and the Indo-Gangetic plains. This is especially the case with modern Europeans, who share the same core components with Sintashta, while also deriving their own Indo-European ancestries from different archaeological cultures and time periods.

Establishing the Context
According to this Eurasia K20 run, Sintashta are approximately 62% Yamnaya, 22% EEF, 10% European and 3% SHG_WHG. Sintashta, at present, appear to be the best proxy for the Indo-Iranians that arrived in West and South Asia. The above four components define the majority (94%) of Sintashta's autosomal profile here.

As discussed elsewhere in Anthrogenica (kudos to user Sein for pointing this out), Sintashta should be considered better surrogates for the Andronovo-related waves which reached West, Central and South Asia than the actual Andronovo samples derived from Allentoft et al. 2015. This is due to the Andronovo samples being derived from the extreme northeast of the archaeological horizon (above the Altai, near Afanasievo). Their position opens up the possibility for extraneous admixture from other steppe groups (including early speakers of Tocharian through Afanasievo?).

The user Kurd has previously demonstrated that recent steppe-related admixture may be segregated from other components. While undertaking this exercise, it also looks like Kurd has done an excellent job addressing the "teal" component that defined up to half of Samara Yamnaya and a big chunk of Sintashta. Kurd's K20 is, in my view, the most effective attempt thus far at separating the complicated autosomal overlapping in West and Central Eurasia.

Introducing the Ancestral Proportions Method (APM)
At present, the genetic landscape in West, Central and South Asia presents as a triple conundrum:

  1. There is, to date (and with the exception of the poor quality Barcin Neolithic Turkish sample), absolutely no interpretable ancient DNA (aDNA) from any of these regions, or indeed, at any point in this broad area's history. Perhaps the greatest obstacle at present.
  2. Autosomal and uniparental marker data from across the region are either inconsistent in sample strategy, or outdated, preventing a knowledge-based approach towards interpreting results.
  3. Archaeological evidence is inconsistent across the region; some cultures are well-studied, whereas others have fallen to mirthful speculation or cannot be readily assigned to any particular prehistoric group.

The APM is, in principle, unconcerned with these issues. Instead, it relies on objective data from a single ancient population to discern the numerical degree of overlap with modern populations.

Whether or not Iranians, Punjabis or Nepalis derive the bulk of their ancestry from unrelated group X or Y is beside the point. The sole purpose of the APM is, therefore, to establish whether or not ancient population Z has left any genetic imprint on modern populations A-K, and if so, to what extent. As such, the methodology described here is completely different as it is assymetrical; one-way gene flow across space and time from one ancestral (extinct) population to numerous extant populations. APM or derivative approaches should be considered as supplementary rather than directly competing with symmetrical modelling techniques such as f3 statistics.

The APM was specifically designed to answer the question; to what degree did Sintashta-related populations contribute to the modern groups of West, Central and South Asia? This simple inquiry has a tendency to attract considerable debate and wildly differing estimates in online discussion boards. Today, using the APM and recently generated data from the Eurasia K20 run, I hope to provide one set of estimations completely independent of extraneous modelling factors.

This approach is entirely reliant on high component specificity (e.g. minimal overlap or bleed-over from one component to another). This particular parameter is not within my control in this instance. As such, the outputs from APM here should be considered cautionary preliminary estimates at best, given the potential for ADMIXTURE-related shortcomings in the absence of relevant aDNA. I anticipate this approach will be much more effective at gleaning admixture extents once aDNA from West and Central Asia dating <2200 B.C. are retrieved.

The APM Approach
To contrast against the ADMIXTURE Sintashta scores, two different approaches are utilised together:

1) Direct Overlap (DO): summarised, for each component, the maximum overlap between a given population average and Sintashta's scores are calculated. This is done individually across all four components (Yamnaya, EEF, European, SHG_WHG) with the outputs added. See image below for schematic (conceptual breakdown of how the DO principle works between hypothetical samples 1 and 2, with Components a-d representing the distinct components).

Schematic diagram showing the principle behind Direct Overlap calculation


2) Component Proportions (CP): A single dominating component (frequency > 50%) is considered modal for the ancestral population of choice, with the other values considered as a fraction of this in modern populations. Given the Yamnaya component makes up almost two-thirds of Sintashta, the ratio between a population's and Sintashta's Yamnaya score are calculated and re-applied to the rest.

There are, however, problems with either approach:

1) DO is overinflated the more West Eurasian a population is. For example, several of the Iranian or Kurdish users at Anthrogenica had component scores greater than what is found in Sintashta (e.g. European being 12% in one sample, when it's 10% in Sintashta). This biases the results for Iranians and Kurds greatly, even when absolute value adjustments are set in place, which the formula shows is (it is highly improbable an Iranian with 10% European derived all of it from Sintashta).

2) CP is more accurate given the Yamnaya component appears highly steppe-oriented in Eurasia K20 and can therefore serve as a direct admixture marker. However, some of the South Asians are scoring very low, or almost none of, the other key components found in Sintashta (e.g. EEF). Due to this, CP doesn't fully account for the "missing variation" in South Asians, biasing the results slightly in their favour.

One convenient workaround is undertaking an average of both scores. However. given CP is intuitively more accurate due to the reasonable specificity of the Yamnaya component, a weighted average biased in favour of CP by a ratio of 3:1 was undertaken. The ratio choice in this variant of the APM is arbitrary here. Other variants (2:1, 4:1) would not result in radically different outcomes.

Results
Full results from up to 24 populations are shown in the Data Sink (interactive chart below). Summarised, Pamiri Tajiks are the most Sintashta-derived at 31.9%. North Caucasian (Ossetian) and Central Asian ethnic groups (Pashtuns, Uzbek, other Tajiks, Turkmen) follow at 22-19%. Various other ethnic groups across West, Central and South Asia follow. The lowest scoring population sampled here are the Makrani at 9.2%.

Internal Validation
The output (Data Sink) readily demonstrates strong correlation between DO and CP scores per population (e.g. Tajik Pamiris at 34.20% & 30.8%, Nepalis at 15% & 14.5% and Makrani at 10.2% & 8.7% respectively account for the top, middle and bottom pairs). The only marked deviation between the DO and CP scores were noted in West Asian populations (Armenians, Kurds, Iranians), as mentioned previously. Thus, empirical confirmation of correlation (e.g. Spearman's rank order) is unwarranted here.

Another means of confirming the validity of APM is to confirm Andronovo is a descendant of Sintashta. As the Andronovo archaeological horizon originates from Sintashta directly, one would expect very high (>90%) Sintashta-derived ancestry among them.

This appears to be the case. compared against Sintashta, Andronovo exhibits DO = 83.9%, CP = 97.3%, an average of 90.6% and a weighted average of 92.8%.

Summarised, these two results (dataset-wide correlation, ancestral-immediate successor high overlap) validate the outcomes of the APM.

Closing Thoughts
The results featured in this entry are in line with both broad uniparental marker data, previously published IBD results (unfortunately removed from sources) and are largely (though not fully) compatible with the degree of archaeological input from Andronovo-derived cultures in Asia. As stated previously, due to earlier shortcomings, they should not be considered definitive.

Given the CP here is not exclusively associated with Sintashta, I anticipate this technique will be more accurate if future "steppe"/"Yamnaya"/"Yamanya_related" components are shown to define more of the Sintashta samples. I look forward to extending this method in the near future.

Acknowledgements
Special thanks to the user Kurd from Anthrogenica for making this data available and obliging member inquiries with productive responses, as well as the user Sapporo for generating several of the population averages.

Tuesday, July 28, 2015

Comparison of Online Y-STR Predictors (Petrejcíková et al.) [Review]

Introduction
An interesting study was published in 2014 based on Slovak Y-STR samples testing for 12 microsatellite markers. The main scope of this paper appears to be the investigation of the efficacy of three publicly available Y-STR haplogroup predictors (Athey, Cullen and YPredictor in alphabetical order) based on these 12 Y-STRs. Study contents shown below.

Y-SNP analysis versus Y-haplogroup predictor in the Slovak population.
Petrejcíková E, Carnogurská J, Hronská D, Bernasovská J, Boronová I, Gabriková D, Bôziková A, Maceková S. Anthropol Anz. 2014;71(3):275-85.
Human Y-chromosome haplogroups are important markers used mainly in population genetic studies. The haplogroups are defined by several SNPs according to the phylogeny and international nomenclature. The alternative method to estimate the Y-chromosome haplogroups is to predict Y-chromosome haplotypes from a set of Y-STR markers using software for Y-haplogroup prediction. The purpose of this study was to compare the accuracy of three types of Y-haplogroup prediction software and to determine the structure of Slovak population revealed by the Y-chromosome haplogroups. We used a sample of 166 Slovak males in which 12 Y-STR markers were genotyped in our previous study. These results were analyzed by three different software products that predict Y-haplogroups. To estimate the accuracy of these prediction software, Y-haplogroups were determined in the same sample by genotyping Y-chromosome SNPs. Haplogroups were correctly predicted in 98.80% (Whit Athey's Haplogroup Predictor), 97.59% (Jim Cullen's Haplogroup Predictor) and 98.19% (YPredictor by Vadim Urasin 1.5.0) of individuals. The occurrence of errors in Y-chromosome haplogroup prediction suggests that the validation using SNP analysis is appropriate when high accuracy is required. The results of SNP based haplotype determination indicate that 39.15% of the Slovak population belongs to R1a-M198 lineage, which is one of the main European lineages.
[Abstract] [Direct Link]

Are They Really Comparable?
Although all three predictors returned similar efficacy rates (~97-99%), it should be noted the authors' chief divisions of interest appear to be the conventional subclade designations currently used in both literature and the genetic genealogy community (e.g. R1a1a-M198). The authors correctly state Y-SNP testing is paramount in definitively gauging subclade classifications, especially for lines substantially downstream of a given haplogroup's phylogeny.

The rest of this entry determines whether these calculators display any other features which may give aspiring researchers reasons to choose one over another.

Subclade Coverage
A substantial difference is observed between the three. Athey's output is oriented around 21 categories spread across most of the major clades/subclades, although haplogroups not commonly found in West Eurasia (e.g. A-D) are unrepresented. Cullen improves on this significantly with 86 subclades, with Y-DNA I receiving the most attention (R1b to a lesser extent), with some improvements, such as well as the inclusion of "A&B". YPredictor has the highest count, hosting over 100 subclades, with the majority found in Y-DNA haplogroups E, G, J, N and R. With the exception of Y-DNA M and S, all are accounted for here.

STR count
Athey is capable of handling 111 Y-STR's (21 and 27-STR versions also available) with the format being listed in either numerical or Family Tree DNA (FTDNA) order. Cullen accepts a maximum of 67 STR's. YPredictor houses approximately 82 STR's. As such, all three are capable of handling a considerable number.

Interface
All three predictors permit the use of batched data and provide different means of categorising the data as seen fit by the user. Instructions are adequately provided for all three as well. As a research utility, however, YPredictor stands out through its' custom YFiler iterations (widely-used format in population genetics publications concerning Y-STRs) and debug feedback before predictions are made by the calculator.

Computational Time
This varies based on the user's CPU processing time, as well as whether they are manually entering STR values or inserting batched data. As such, this probably shouldn't be a pertinent factor in deciding which calculator to use.

Output Information
All three produce similar information (subclade prediction with probability expressed as a percentage).

Conclusion
Before summarising these findings, it is worth noting that Athey's predictor precedes Cullen's and YPredictor. As such, any perceived deficiencies in subclade breakdown or functionality are likely a result of age. Athey's predictor was widely used in the past, irrespective of the current application rate.

All three predictors are of use to genetic genealogists. This entry concludes the following "idealised" purposes for each:

  • Athey - For users keen to utilise upwards of 111 FTDNA Y-STR's as cross-validation against the other two
  • Cullen - Best for those seeking refined Y-DNA I or R1b subclade predictions
  • YPredictor - Most versatile and research-friendly, best worldwide coverage of Y-DNA subclades

As such, the three calculators certainly are comparable for making basic Y-STR predictions for West Eurasians, but obvious differences exist with respect to non-West Eurasian subclade coverage.

If compelled to make a single choice, I would recommend Cullen first to genetic genealogists of Northwest European paternal heritage (given the high frequencies of Y-DNA's I and R1b). YPredictor would be the best choice for those belonging to subclades more common outside Europe. This also explains why it has been extensively used in this blog to date. Athey's function has otherwise been usurped by the other two. 

Thursday, July 9, 2015

Presenting Bakhtiari Uniparental Marker Data [Original Work]

Introduction
Bakhtiari people (Google Search)
The Bakhtiari people are one of Iran's ethnic minorities. Inhabiting the Iranian plateau's southwestern portion, the Bakhtiari traditionally maintained a hierarchical social structure with a genealogical basis (with organisations or positions including rish safids, kalantars, khans and ilkhani) [1]. Historically, the Bakhtiari have played a role in several pivotal events leading up to the formation of the modern Iranian state [2].

In recent years, the Bakhtiaris have received additional attention in the literature with respect to ancestry. This has been achieved predominantly via uniparental markers (Y-DNA and mtDNA) and coincides with work addressing the genetic origins of other ethnic minorities in Iran. For instance, in 2012, Grugni et al. expanded our understanding of Iranian Y-DNA across the country through sampling almost 1,000 unrelated men across 15 distinct ethnic groups (previous entry).

In spite of such developments, however, the Bakhtiari have not received much attention in either the genetic genealogy community or the literature. This entry attempts to explore the available data and arrive at a stable set of results for this group.

Method
Khuzestan province, Iran (Wikipedia)

Search engines were limited to PubMed and Google Translate. Search terms included "Bakhtiari", "Y-DNA", "Y-Chromosome", "mtDNA", "mitochondrial", "STR", "SNP", "HVR" and "Iran". No limit was placed on publication date. All mtDNA and Y-DNA data was compiled. Where Y-STRs are presented, these were run through Vadim Urasin's YPredictor (v1.0.3 offline version). A 70% prediction strength threshold was implemented. If the resulting data is sparse, novel ways of consolidating the information will have to be devised and explained during the course of this entry.

Search Outcomes
Three studies were found to contain Bakhtiari uniparental data, with one partially covering Bakhtiari mtDNA (Derenko et al. 2013 [3]) and two for Y-DNA (Nasidze et al. 2008 [4], Roewer et al. 2009 [5]). The Bakhtiari populations featured mostly reside in Izeh, Khuzestan province, Iran [3-5] with a single sample coming from Lurestan province, Iran [4].

mtDNA Results
Derenko et al. featured only two Bakhtiari samples. One belonged to mtDNA H*, which was also observed in several Persian (Kerman province) and Qashqai samples, alongside a single Armenian. [3] The only other sample was mtDNA U2d2, also found in a single Persian (Kerman province). The authors noted that the combined frequency of mtDNA's U2c and U2d in Iran were highest among the Persians nationwide (approaching 10%) [3]. However, given the absence of additional samples, no reasonable conclusions can be drawn from these results.

Nasidze et al. provides both frequency and HVR1 derived variance data on the Bakhtiari and Ahwazi Arab populations [4]. The Bakhtiari appear to chiefly belong to mtDNA haplogroups N, U, H, T and J (below).

mtDNA Frequency Data from Khuzestan province, Iran {Nasidze et al. 2008)

Unfortunately, further information on subclade breakdown is not provided. However, as concluded by the authors and is evident through frequency data, the mtDNA profile of the Bakhtiari is almost identical to the Ahwazi Arab sample. Additionally, Nasidze et al. note "considerable sharing of HV[R]1 sequences" between these two groups [4]. In tandem with the inferences described above through Derenko et al., it appears that significant matrilineal marker overlap does exists across the Iranian plateau.

Y-DNA Results
Nasidze et al. first published data on 53 unrelated Bakhtiari men [4]. Due to substandard Y-SNP genotyping, the only conclusions that may broadly be discerned is the Bakhtiari chiefly belong to Y-DNA haplogroups J2-M172 (25%) and G-M201 (15%) (Data Sink). In this respect, these results cannot give observers a reliable indication of the Bakhtiari Y-DNA profile. Roewer et al.'s data indicates that some number of Bakhtiari do share the same core 17 STR haplotypes among one another (e.g. J2a4, T*)  but do not with any other samples across the country [5].

One "quick and dirty" way of addressing this problem is by using the YFiler (17 STR) Bakhtiari haplotypes (Data Sink) from Roewer et al. to "recharacterise" the Nasidze data. This is deemed the most suitable option for two reasons:
1) Nasidze et al. has an adequate sample size (n=53) but inadequate Y-SNP genotype selection
2) Roewer et al. has an inadequate sample size (n=18) and no confirmed Y-SNP testing, but the YPredictor data should provide reasonable subclade determination with a 70% probability threshold in place

"Recharacterisation" is achieved by expressing the Nasidze et al. data by the predicted subclade information provided by the Roewer et al. SNP predictions proportionally. For example, Nasidze et al. found "DE-YAP" at 8%, with the Roewer et al. predicted results showing 5.6% each for "DE*" and "E1b1b1". As both these subclades are contained within the DE-YAP node, the original value is recharacterised as DE 4% and E1b1b1 4%. The outcome is presented numerically (Data Sink) and demonstrated below (values rounded down to fit to 100%):


Y-DNA J2a4 constitutes the largest subclade (22.1%), with H (10.8%), R1a1a (8.9%) and T* (8.5%) following. The results imply considerable Y-SNP diversity within the Izeh Bakhtiari.

These results are somewhat at odds with that suggested by the Roewer et al. figures, particularly the frequency of Y-DNA J2-M172 (50% in Roewer et al. vs. 25% in Nasidze et al.). The most likely basis for this is sampling bias, given the former only tested for 18 individuals. It should be noted that Y-DNA J-12f2 has been documented to have a major (>60%) presence in Southwestern Iran (Quintana-Murci et al. 2001) with the majority of this likely being represented by downstream J2-M172 subclades (as per Grugni et al. 2012). It is therefore plausible for some Bakhtiari groups to yield exceptionally high frequencies of Y-DNA J2-M172 (likely J2a4 subclade) with future testing. The breakdown shown above is also broadly in line with past data from Southwestern Iran (Grugni et al. 2012).

It must be cautioned that literal interpretation of these results (both subclade breakdown and numbers) are not advised due to the inaccuracies brought by the "recharacterisation" and the lack of Y-SNP confirmation in Roewer et al.

It should also be emphasised that, as a tribal group, the Bakhtiari have most likely undergone genetic drift in their uniparental markers over time. As such, the finding of ~10% Y-DNA H is not completely surprising. Whether these values will be substantiated in future work is an open question.

Conclusion
The current evidence does suggest that the Bakhtiari closely resemble and share heritage with their immediate neighbours matrilineally, resting upon a backdrop of some common mtDNA diversity across the Iranian plateau. Inferences beyond this point will fall towards the realm of speculation.

The situation appears somewhat inverted on the Y-DNA side, where non-existent Y-STR haplotype sharing is observed with other groups in the Iranian plateau. The "recharacterised" data gives us an approximate idea of what the Bakhtiari Y-DNA profile should look like if Nasidze et al. used a better Y-SNP genotype panel.

Other ethnic minorities in Iran have received consistent attention in this respect, such as the neighbouring Qashqai and Lurs (Farjadian et al. 2011). The paucity in Bakhtiari uniparental marker data indicates this is very much an area that needs immediate attention. An initial first direction for researchers is to sample at least 50 unrelated individuals from Izeh using a more conventional Y-SNP genotype panel. Additional clarity will be gained by testing further areas, as well as reconciling the Bakhtiari tribal structure with these outcomes.

Acknowledgements
A very special thanks to the user "J Man" from Anthrogenica for bringing this interesting topic to my attention.

[Edit 10/07/2015]: I have also learned while researching this topic that Dr. Ivan Nasidze unfortunately passed away in 2012. His work served as an important early foundation towards understanding the genetic constitution of Caucasian and Iranian populations. May he rest in peace.

References
1. Bakhtiari. Last Accessed 25/06/2015: http://www.everyculture.com/Africa-Middle-East/Bakhtiari.html

2. Study of the Qajar government policy at the case of Household Bakhtiari. Last Accessed 6/07/2015: http://waliaj.com/wp-content/2014/Issue%201,%202014/26%202014-30-1-pp.124-127.pdf 

3. Derenko M, Malyarchuk B, Bahmanimehr A, Denisova G, Perkova M, Farjadian S. Complete mitochondrial DNA diversity in Iranians. PLoS One. 2013 Nov 14;8(11):e80673. doi: 10.1371/journal.pone.0080673. eCollection 2013.

4. Nasidze I, Quinque D, Rahmani M, Alemohamad SA, Stoneking M. Close genetic relationship between Semitic-speaking and Indo-European-speaking groups in Iran. Ann Hum Genet. 2008 Mar;72(Pt 2):241-52. doi: 10.1111/j.1469-1809.2007.00413.x. Epub 2008 Jan 20.

5. Roewer L, Willuweit S, Stoneking M, Nasidze I. A Y-STR database of Iranian and Azerbaijanian minority populations. Forensic Sci Int Genet. 2009 Dec;4(1):e53-5. doi: 10.1016/j.fsigen.2009.05.002. Epub 2009 Jun 5.

Friday, September 5, 2014

Worldwide Population Y-DNA Collated (Xu et al.) [Review]

Approximately one week has passed since a new paper by Xu et al. was indexed by PubMed and made available online ahead of printing:

"The Y chromosome is one of the best genetic materials to explore the evolutionary history of human populations. Global analyses of Y chromosomal short tandem repeats (STRs) data can reveal very interesting world population structures and histories. However, previous Y-STR works tended to focus on small geographical ranges or only included limited sample sizes. In this study, we have investigated population structure and demographic history using 17 Y chromosomal STRs data of 979 males from 44 worldwide populations. The largest genetic distances have been observed between pairs of African and non-African populations. American populations with the lowest genetic diversities also showed large genetic distances and coancestry coefficients with other populations, whereas Eurasian populations displayed close genetic affinities. African populations tend to have the oldest time to the most recent common ancestors (TMRCAs), the largest effective population sizes and the earliest expansion times, whereas the American, Siberian, Melanesian, and isolated Atayal populations have the most recent TMRCAs and expansion times, and the smallest effective population sizes. This clear geographic pattern is well consistent with serial founder model for the origin of populations outside Africa. The Y-STR dataset presented here provides the most detailed view of worldwide population structure and human male demographic history, and additionally will be of great benefit to future forensic applications and population genetic studies."

This paper showcases a staggering 979 distinct Y-DNA 17 STR haplotypes across 44 distinct populations from across the world. These haplotypes are soon to be uploaded to the Y-STR Haplotype Resource Database (YHRD). The authors have made all the haplotypes, together with a slew of additional information, publicly available independent of the official article (raw haplotypes, Y-DNA haplogroup predictions).

In this entry, the collated results of all populations are reviewed, together with cursory inferences provided with the intention of aiding interpreting them.


Method
All 979 haplotypes were retrieved through the above link. Each population dataset was run through Vadim Urasin's YPredictor (v1.5.0). A 70% prediction strength threshold was implemented. All nomenclature were reduced to the haplogroup level to avoid confusion for future readers should these change in time. These haplotypes formed the collated population results.


Results
877 haplotype predictions met the 70% threshold established. Without having access to the original study, it is apparent that the authors also used Urasin's YPredictor, given the identical predictions.

The collated population results have been organised by the location of sampling by continent or region and can be found in the Data Sink. Direct links to each section accompanied by the list of populations sampled are listed below for the reader's convenience with a brief runthrough of some interesting findings under each.

1. Europe Adygei (Russia), Chuvash (Russia), Danes (Denmark), Finns (Finland), Hungarians (Hungary), Irish (Ireland), Khanty (Russia), Komi (Russia), Russians (Archangelsk), Russians (Vologda), Yakut (Russia)

The Adygei present as expected; they are predominantly G-P15 and J-L26 with various subclades of haplogroup R. Various subclades of haplogroups N and R define the Chuvash, with an additional appearance by J-L26 and Q-MEH2. Ethnic Russian populations appear to have their own regionalised diversity on the backdrop of being predominantly R-M198 and downstream subclades (particularly R-M458). The Irish are predominantly (~81%) R-M269, although the presence of a single man with H-M82 is surprising. Finally, the Yakut too belong overwhelmingly to haplogroup N (~78%) with a single man being predicted as I-P37.2.

2. Middle-East Druze (Israel), Samaritans (Israel), Yemenite Jews (Yemen)

The Druze are one of the better-sampled populations in this study, where they are mostly represented by various subclades of haplogroups E and G, together with R-M269 and T-L162. The Samaritans are defined (in order of decreasing frequency) exclusively by J-L26, J-P58 and E-V22. Finally, the Yemenite Jews present with a similar (though more restricted) spectrum as the Druze with some differences in frequency.

3. East Asia Ami (Taiwan), Atayal (Taiwan), Cambodians (Cambodia), Chinese (USA), Chinese (Taiwan), Hakka (Taiwan), Japanese (USA), Koreans (S. Korea), Laotians (Laos)

The Ami are unsurprisingly defined mostly by downstream subclades of haplogroup O, although there does appear to be an I-M223 and L-M317 among them. The Atayal, also of Taiwan, are exclusively O-MSY2.2. The Cambodians appear to have even more lineages which are typically expected further west. The Japanese boast the highest frequency of D-M55 out of all the populations sampled (21.1%). The Korean results contrast with this through the presence of men with N*-LLY22g(xM128,P43,Tat) and Q-MEH2. The Laotians appear to have one man with DE*-M1, although this will require SNP testing to definitively confirm.

4. Africa Ashkenazi Jews (S. Africa), Biaka Pygmies (CAR), Chagga's (Tanzania), Ethiopian Jews (Ethiopia), Hausa (Nigeria), Ibo (Nigeria), Masai (Tanzania-Kenya), Mbuti Pgymies (Congo R.), Sandawe (Tanzania), Yoruba (Nigeria)

The Ashkenazi Jews of South Africa appear to have a Y-DNA spectrum that is completely typical of Southwest Asians (please compare with the Druze). The Bagandu are largely defined by subclades of haplogroups B and E. Tanzanians here are completely haplogroup E and T. The presence of G-M15, J-L26 and R-M269 among the Hausa is surprising and may be attributed to a colonial European presence or some other forms of interaction.  The Sandawe have some rather unusual results given their geographical position (I-P37.2 and Q-MEH2), raising the possibility these haplotypes were predicted incorrectly.

5. Australasia Micronesians (Micronesia), Nasioi Melanesians (Solomon Islands)

Both the Micronesians and Melanesians have an unusually diverse spectrum. It is difficult to ascertain whether the parahaplogroups shown are genuine or, as described above, a result of incorrect predictions. A recent paper revealing the presence of newly discovered offshoots from haplogroup K in Southeast Asia [1] raise the possibility some of these may be genuine.

6. Americas Karitiana (Brazil), African Americans (USA), European Americans (USA), Maya (Mexico), Pima (USA), Rondonian Surui (Brazil), Ticuna (Brazil)

The Karitiana are predominantly Q-MEH2 but appear to have some non-American admixture through E-U175. African Americans are represented as an approximately 4:6 mix of R-M269 against various haplogroup E subclades. The Maya population, like the Karitiana, are Q-MEH2 with additional markers from outside the Americas, as are the Pima. The trend continues with the Quechua people, although C-M217 and T-L162 make their first appearance here. Finally, the Rondonian Surui and Ticuna are completely Q-MEH2.


Criticisms
There are at least two areas of the authors' methodology which are deemed to be drawbacks and prevent this study from being exceptionally informative.

Firstly, the authors evidently used the YFiler sampling array to complete this investigation. In an era where commercial testees can enjoy upwards of 111 Y-STR's, the long-term usefulness of this paper's extensive worldwide sampling is cut short. Another recent paper presenting Y-STR's worldwide has done so using 23 rather than just 17. [2]

My comments are more critical of the authors' sampling strategy. More data is never strictly a burden in the world of population genetics, but the informativeness of groups such as "European Americans", "Irish" and Chinese born in the USA is questionable. For instance, these groups are already richly represented, be it in the current literature or FTDNA Project groups. The apparent issue with these samples would have been rectified if they were simply obtained from a single area, providing regional specificity which may prove useful in better establishing genetic variation within Ireland, for example.

Finally, the haplotypes could have also received a "backbone" SNP test each to definitively place them within the current phylogeny. The drawbacks of STR-alone testing became readily apparent with some of the African samples. I can only speculate it is the highly divergent nature of certain uniquely African haplotypes from Eurasian ones which produced these spurious results.


On Mutation Rates (Quick Discussion)
In this study, both BATWING and the average squared distance (ASD) method were used. Within each, four different mutation rates were implemented. On initial inspection these appear to vary wildly. However, on closer examination, it appears all the BATWING most recent common ancestor (MRCA) calculated ages are approximately twice as old as those generated by the ASD method. Even within each technique there is substantial variation; the evolutionary rate appears approximately three times greater than the others. Furthermore, these "other" mutation rates do tend to congregate around a common similar value (e.g. through BATWING, the calculated global age of their Y-DNA R-M198 haplotypes was 5.5k, 6.1k and 6.2kya), which would intuitively suggest the "actual" value lies somewhere within these either through BATWING or ASD. The discrepancy here cannot be overstated and calls into question why some researchers are still utilising a "blanket" mutation rate across several loci which are shown to have significantly different tendencies to mutate (colloquially described as "slow", "medium" and "fast" mutators). I am uncertain whether the authors are in fact doing this, but the implications of this are apparent, as they prevent rational "fitting" of these numbers into candidate prehistoric narratives from happening. This entire topic will likely be explored in a future entry.


Conclusion
Although at least three drawbacks (four including the MRCA calculations) are identified here, this study provides researchers worldwide with a plethora of data from populations that are either poorly represented in the current literature or have been entirely absent until present. The majority of the results outline the wide Y-chromosomal diversity across the world, whilst also revealing specific trends that have been established in both the current literature and in online discussion boards. An mtDNA counterpart of this paper would be a wonderful addition to see sometime in the near future.

There is a bountiful amount of data to be interpreted with pre-existing ideas/models and compared with prior studies which place a premium on each population's area. I welcome any form of dialogue regarding the results. There, is, for many of us, plenty to elucidate. The conclusion does not end here; I encourage as much further investigation and thought by the readers as the data permits.

[Addendum @ 05/09/2014]: Error regarding Karitiana data. Modified and updated.


Citations
1. Karafet TM, Mendez FL, Sudoyo H, Lansing JS, Hammer MF. Improved phylogenetic resolution and rapid diversification of Y-chromosome haplogroup K-M526 in Southeast Asia. [Last Retrieved 03/09/2014]: http://www.nature.com/ejhg/journal/vaop/ncurrent/full/ejhg2014106a.html 

2. Purps J, Siegert S, Willuweit S, Nagy M, Alves C, Salazar R et al. A global analysis of Y-chromosomal haplotype diversity for 23 STR loci. [Last Retrieved 05/09/2014]: http://www.fsigenetics.com/article/S1872-4973%2814%2900084-2/abstract

Wednesday, August 6, 2014

Anchored in Armenia: An Exercise in Genetic Relativity [Original Work]


Introduction

Location of the Armenian Highlands in West Asia
As is the case with many groups in the region, the Armenians are, anthropologically-speaking, a very unique modern ethnicity. Situated in the Armenian Highlands (an expansive area straddling between the Zagros & Caucasus range) with a settlement history dating since the Neolithic, the modern Armenian people have maintained a distinct culture both shaped and shielded by the mountainous territory they inhabit. [1] One unique aspect of the Armenian people is their language; Modern Armenian is an Indo-European language belonging to its' own branch. There has long been scholarly debate regarding its' linguistic exodus from the Proto-Indo-European homeland (commonly accepted by modern linguists as the Pontic-Caspian steppe) [2] through to its' historical seat in the South Caucasus. As is evident by the attested Urartian and Hurrian loanwords in later forms of the language, Armenian must have been spoken by its' current forebears since at least before 500 B.C. [3] Various genetics enthusiasts (including myself) on differing occasions have cited this as an indication of an aboriginal West Asian genetic layer accompanying the Urartian-Hurrian vocabulary substratum.

Presumably due to the on-going political instability in West Asia, there has been an unfortunate lack of ancient DNA (aDNA) recovery in the areas adjacent to the Armenian Highlands. Alongside the Armenians, West Asia proper is also home to Anatolian Turks, numerous Kurdish groups, the Assyrians, several Jewish minorities and various ethnic groups within Iran. Inter-relation of all these groups in differing extents has been demonstrated in both published studies [4] and the open-source projects. [5,6]

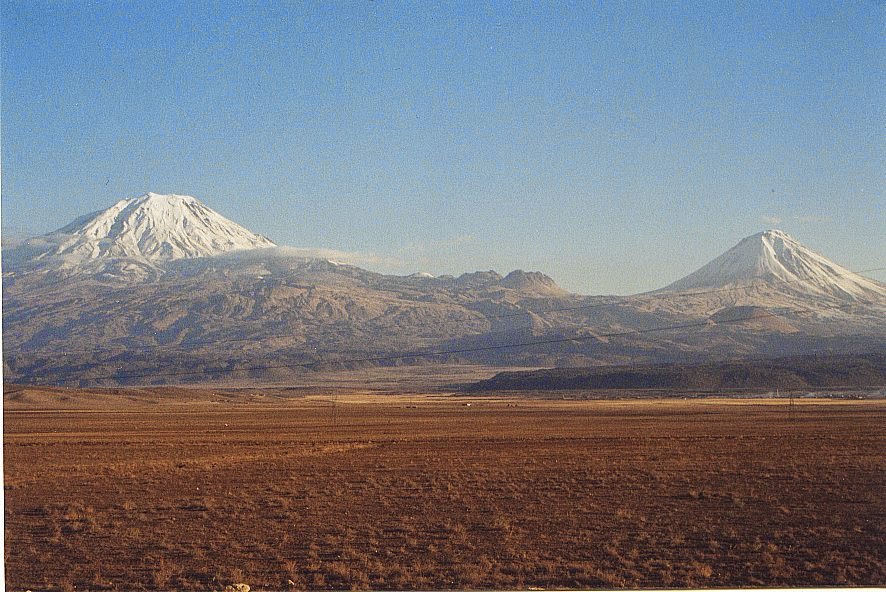
Mount Ararat - A symbolic item in Armenian culture
Although they have most likely experienced their own demic events in prehistoric times, the insular nature of the Armenians relative to their neighbours allows them to be used as a stand-in for the aDNA we currently lack in this part of the world. In this blog entry, the Armenians will therefore be considered as a surrogate for autochthonous West Asian ancestry. They will be treated as a primary donor population (PDP) for several other West Asian groups, in an attempt to flesh out the degree of mutual shared ancestry, as well as the directions of added affinities beyond the region. This is by no means an authoritative attempt to purport a particular image of the West Asian genetic landscape, but an attempt instead to provoke discussion and explore the underlying structure of the region through a manner that should hopefully yield fruitful results in the glaring absence of aDNA in the region.


Working Hypotheses

1. Given the demonstrated similarity in autosomal DNA profiles (here and here), modern Armenians will serve as a reasonable PDP for all tested populations.

2. Furthermore, the genetic difference (GD) will likely be dictated by geographical proximity to the Armenians, or a (lack of) history of admixture with them.

3. Finally, the other donor populations will be anticipated either by virtue of geography or language.


Method

The Dodecad K12b Oracle was used to undertake this small project (please visit link for technical information). When executed through R, the program was set to Mixed Mode and fixed to 500 results for every iteration per population. The command entered therefore remained the same each time:

DodecadOracle("WestAsianPopulation",mixedmode=T,k=500)

Samples consist of nine location-specific populations (Iranians, Kurds_Y, Azerbaijan_Jews, Iraq_Jews, Iran_Jews, Turks, Turks_Aydin*, Turks_Kayseri*, Turks_Istanbul*) and four Dodecad participant averages (Iranian_D, Kurd_D, Assyrian_D, Turkish_D). A total of thirteen populations were therefore included.

From the output, only those combinations expressing an Armenian population as a PDP were selected. In this context, the Armenians will be considered a PDP if their "ancestral" percentage exceeds 50%. A maximum of ten were collected per population. In the event the number of combinations exceeded this, the subsequent combination lists are terminated with an ellipsis.

* Although not included in the original Dodecad K12b Oracle dataset, Dienekes has conveniently shared the population averages for these samples here. These were manually inserted into the command.


Results

Iranian and Kurdish Oracle results
Unsurprisingly, the Iranians and Kurds all display similar results. Specifically, the adoption of either Makrani or Balochi as the secondary donors when Armenians are fixed as a PDP. The proportions are also comparable between all. The Iranians appear to fit the Armenian + Balochi/Makrani combination slightly better than the Kurds (GD=4.04-5.16 vs. 5.03-6.65 to 2 d.p. respectively). It is also worth observing that both Iranians and Kurds, irrespective of sampling strategy (location-specific or Dodecad average), do not have Mixed Mode results which exceed ten.

Assyrian and select Near-Eastern Jewish Oracle results
The Assyrians are one of the groups of interest, given the demonstrated autosomal similarity between them and Armenians (here). As anticipated, their Mixed Mode results well exceed ten and the best fits (GD=1.66-1.82 to 2 d.p.) are all, coincidentally, with the Near-Eastern Jewish groups studied here. Subsequent matches include additional populations (e.g. Saudi, Bedouin, Syrian) where the GD remains relatively small compared to the Iranian and Kurdish values (>3.15 to 2 d.p.).

The Near-Eastern Jewish groups largely mirror the Assyrian results, although some key differences should be outlined:

  • The Azerbaijani Jews have a GD similar to the Assyrians in range, setting them apart from the Iraqi and Iranian Jews. This seems to fit geography. However, if the association was strictly geographical, one would expect the Assyrians to lie in-between the Azerbaijani Jews from the Iraqi and Iranians. This may be genetic evidence of additional and direct ancestry between Armenians and Assyrians at some (or various) point(s) after the Near-Eastern Jewish groups had formalised their identities.
  • Saudis appear as a secondary donor population in all groups. Interestingly, they appear to have an inverse relationship with geographic proximity to the Armenian Highlands; Iraqi, Iranian and Azerbaijani Jews are 20.4%, 16.1% and 7.8% "Saudi" respectively. The Assyrians too fall on this cline despite the point raised above.

Anatolian Turkish Oracle results
Finally, the Anatolian Turks provide us with another set of interesting values and pairs:

  • Mixed Mode results from Western Turkey (Aydin, Istanbul) largely exhibit a combination of Armenian with various European ethnic groups or nationalities, which can be predominantly ascribed to geography. Please note the comparatively large GD among the Aydin average (>9.93 to 2 d.p.), which contrasts with Istanbul. I suspect the cosmopolitan nature of Istanbul has resulted in an artefactual lowering of the GD, given Anatolian Turks from
    across the country have moved their for employment purposes. [7]
  • In contrast, the samples listed as "Turks" in Dodecad K12b (from the Behar et al. dataset, located in Central-South Turkey) model well as a combination of Armenian with either the Chuvash, Nogay, Uzbek or Uyghur. European secondary donors do make an appearance once more. Please also note their GD is the smallest out of the Turkish averages investigated (4.20 to 2 d.p.).
  • The Kayseri average (Central Turkey) yielded no results matching the criteria outlined in "Method". However, the Assyrians instead made a frequent appearance as primary donors from GD=6.17 onwards. Given the genetic affinity between Assyrians and Armenians (refer above), and the consistency displayed by the Armenians as a PDP for other Turkish averages, this result can be considered anomalous. A close inspection of the Dodecad K12b proportions reveals the Kayseri Turks were on average approximately 1.5% more Southwest Asian than all other Turkish populations, explaining why Assyrians took preferential placing over Armenians as the PDP. The cause of this slight increase is unknown at present.
  • The Turkish_D average best resembled that of Istanbul, albeit with slightly more Armenian and less European proportions. This would suggest that, overall, the Dodecad Turkish participants map somewhere just east of Istanbul despite the presumably diverse backgrounds. 
  • Finally, all averages produced Mixed Mode results which exceeded ten in number.

IBD Segment Indications

To corroborate the findings of this investigation with additional genetic data, I refer to the Dodecad Project's fastIBD analysis of Italy/Balkans/Anatolia and fastIBD analysis of several Jewish and non-Jewish groups. As the analyses do not completely encompass those groups studied here, the results cannot be accepted wholesale. However, there does appear to be a broad agreement with some of the results in this investigation. For example, the Armenians and Assyrians have a demonstrated level of "warmth" to one another beyond background sharing.


Further Work

This investigation would have benefited from Azeri Turkish samples via the Republic of Azerbaijan. Additionally, a better breakdown of Kurdish, Iranian and Assyrian samples, akin to the site-specific sampling seen here in the Anatolian Turks, would have been ideal. Finally, as stated above, this investigation would have benefited from the inclusion of IBD segment analysis specific to the studied groups. Should time permit and the desired samples be made available in the future, this would be a natural line of inquiry to further what has been explored here.


Conclusion

Addressing the three hypotheses stated at the beginning in order:

1. Armenians certainly have behaved as a reasonable proxy for an autochthonous West Asian PDP in most of the populations tested (sole exception being the Kayseri Turks although this appears to be an anomalous response to slightly more Southwest Asian scores). The scores vary depending on the presence of the secondary donors, but Assyrians and Jewish populations from Azerbaijan, Iran and Iraq appear to have the largest proportion of this (occasionally surpassing 90%). All Iranians and Kurds, on the other hand, scored the least overall (approximately 65-75%). The Turkish range lies in-between these two.

2. Unfortunately, this isn't clear. The lack of regional results for Kurds and Iranians, together with a lack of samples specifically from Eastern Turkey, prevents any conclusion being reached on this point. The Near-Eastern Jewish populations studied here certainly do form a cline of Armenian "admixture" that is fully in line with geography. Furthermore, the large GD observed in Aydin Turks does support this idea, leading me to cautiously propose geography does indeed play a role. The second point also provides us with a partial answer, as the Assyrians demonstrate more of this than one would expect given their geographical placement based on GD, as well as fastIBD evidence from elsewhere.

3. With the exception of the Assyrians and Near-Eastern Jewish groups, the secondary donors overwhelmingly matched my expectations regarding their placement with whichever group that was studied (e.g. Iranians and Kurds towards South-Central Asia, Turks towards either Europe or Central Asia proper).

Over the coming years, with the availability of more data, we should hopefully move away from the population averages that have been used by various open-source projects. It has been empirically demonstrated here that regional results will differ significantly from nationwide averages (e.g. Aydin Turks vs. Turkish_D).

This also holds true on an individual basis; the best Oracle match for one Iranian via the described methodology was 56.4% Armenians_15_Y + 43.6% Tajiks_Y (GD=5.44 to 2 d.p.), differing significantly from both the Iranian and Kurdish averages.

I suspect the gentlemen running the numerous open-source projects are aware of this caveat and are, justifiably so in my opinion, making do with currently available data.

In closing, this investigation has also determined that, on the basis of the presumption of an Armenian-like autochthonous West Asian substrate, the studied populations as a whole have an apparent degree of inter-relatedness by virtue of this common South Caucasian autosomal heritage, albeit with the presence of highly significant affinities to elsewhere in Eurasia, be it population-wide, regional or even individual.


Speculations

The first topic is regarding the Iranians and Kurds; why were their average secondary donors always the Balochi's and Makrani, rather than more northern groups, such as the Tajiks? I suspect, when applied to population averages, the Oracle program effectively minimises intra-population variation to the point where only the broadest of affinities are indicated. In the case of Iranians, the secondary donor would therefore be one with genetic features that tend to emphasise the difference between Armenians and Iranians (e.g. additional South Asian and Gedrosian admixture). A similar conclusion can be reached with respect to the Turks.

Another interesting point is the demonstrated close relationship between the Assyrians and various Near-Eastern Jewish groups. This has been speculated upon in various discussion forums in the past. More precise tools will be required to elucidate whether these populations share legitimate ancestry with one another, or the affinity is happen-stance, instead reflecting the mixture of similar Near-Eastern groups with (again) similar Caucasus-derived groups at some point in history.

[Addendum I, 07/08/2014]: For a continuation on this with a fellow genome blogger, please read the Comments below.


Acknowledgements

Full credit for both the generation of raw population data and the Oracle program go to Dienekes Pontikos (Dodecad Ancestry Project).

Map of Armenian Highlands from Wikipedia.org. Photo of Mount Ararat courtesy of NoahsArkSearch.com.

Finally, I must refer all visitors interested in understanding the genetic constituency of the Armenian people to the FTDNA Armenian DNA Project. For a more interactive learning experience, two of the administrators (Mr.'s Simonian and Hrechdakian) recently delivered a lecture on this topic, garnishing it with a deeper description of anthropological and geographical aspects as described here.


References

1. Samuelian TJ. Armenian Origins: An Overview of Ancient and Modern Sources and Theories. [Last Accessed 3/08/2014]: http://www.arak29.am/PDF_PPT/origins_2004.pdf

2. Clackson J. Indo-European Linguistics: An Introduction. Cambridge Textbooks in Linguistics [Last Accessed 4/08/2014]: http://caio.ueberalles.net/Indo-European-Linguistics-Introduction/Indo-European%20Linguistics%20-%20James%20Clackson.pdf

3. Greppin JAC. The Urartian Substratum in Armenian. [Last Accessed 4/08/2014]: http://science.org.ge/2-2/Grepin.pdf

4. Grugni V, Battaglia V, Hooshiar Kashani B, Parolo S, Al-Zahery N et al. Ancient migratory events in the Middle East: new clues from the Y-chromosome variation of modern Iranians. PLoS One. 2012;7(7):e41252.

5. Dodecad Ancestry Project: ChromoPainter/fineSTRUCTURE Analysis of Balkans/West Asia [Last Accessed 4/08/2014]: http://dodecad.blogspot.com/2012/02/chromopainterfinestructure-analysis-of.html

6. Eurogenes Genetic Ancestry Project: Updated Eurogenes K13 and K15 population averages [Last Accessed 4/08/2014]: http://bga101.blogspot.com/2014/03/updated-eurogenes-k13-and-k15.html

7. Filiztekin A, Gokhan A. The Determinants of Internal Migration In Turkey. [Last Accessed 05/08/2014]: http://research.sabanciuniv.edu/11336/1/749.pdf

Saturday, July 13, 2013

A Hidden Gem in Central Asia: Previously Unknown Y-DNA R1b Haplotype [Original Work]

1. Introduction

Central Asian Y-DNA diversity has been an area of constant intrigue in the genetics community. Wells et
al.'s The Eurasian Heartland: A continental perspective on Y-chromosome diversity paved the way, with several others following in their regard. Members of the same team (including Dr. Wells) produced another paper - A Genetic Landscape Reshaped by Recent Events: Y-Chromosomal Insights into Central Asia - on the same topic in the following year, this time headed by Dr. Tatania Zerjal. I noted a greater emphasis on East-Central Asian populations as well as a mentioning of Y-STR analysis in the study itself. However, none of this data was supplied, with only Y-SNP information included (shown sporadically in this entry). The age of this paper is apparent through the nomenclature used (see Method section).

Several months ago, I made a request to obtain the Y-STR data from this study to one of the co-authors, Dr. Tyler-Smith, who kindly replied with the results of all sampled populations (Data Sink > Zerjal et al. Raw Data).

In this blog entry, the Y-STR data is showcased with a special emphasis on the Y-DNA R1b-M269 which was discovered.


2. Method
Y-SNP Phylogeny in original paper (Zerjal et al.) [1]


The maximum number of compatible Y-STR's were utilised for processing in Urasin's YPredictor for easier haplogroup identification (14 of a possible 16, DYS434 and 435 were excluded). All data was run through YPredictor. Only samples with ≥70% probability were included in the final results (Data Sink > Processed Data). As discussed below, relevant findings are compared with the basic Y-SNP haplogroups shown in the original study (on right).

One point which needs to be addressed immediately is the high frequency of "_DE-M1" and "P-M45". It appears that the STR selection has led to a phantom result, rendering many of the samples useless. For instance, the original study shows the Kazakhs belong overwhelmingly to C3c-M48, [1] although the probable results shown here are mostly "_DE-M1".  The exclusion of DYS434 and 435 from my level of processing likely contributed to this; if one assigns equal weight to the statistical strength of a prediction, removal of two STR's from a panel numbering 16, accuracy is reduced by 12.5%. Additionally, some conversion error seems to have applied with DYS437 (i.e. a value <12 is unusual). Therefore, "_DE-M1" and "P-M45" results were dismissed on account of the mismatch between predicted and likely confirmed haplogroups probably due to a compatibility issue between the study's STR panel and YPredictor..


3. Results

As the majority of samples were removed owing to the caveat described above, this entry will take a qualitative rather than quantitative approach to analysis on the general picture formed. Much of the remaining results are congruent with findings in other papers. Populations around the Caucasus are signified by plenty of R1b-M269, J2a-M410 and G2a-P15. Tajiks and the Kyrgyz were predominantly R1a1a-M17. Mongolians and other East-Central Asian ethnic groups yielded the most O3-M122 and "NO-M14" (likely to be Y-DNA N or O suffering from the STR restrictions described in the Method section).


Y-SNP distribution in Central Asia (Zerjal et al.) [1]


3i. The R1b Signal 

R1b-M269 was found across Central Asia and not only in the Caucasus (Armenians, Azeris, Georgians, Ossetians). It was mostly detected among the Turkmen (trk1, trk2, trk4, trk6, trk7, trk22, T29, T32) with a single sample among the Uzbek (uz-s110). [1]

Analysis of the haplotypes (including DYS434 and DYS435) revealed the nine Central Asian R1b samples belonged to a secure haplotype (Data Sink > R1b Results). trk6 diverged greatest, albeit with two 1-step mutations on DYS393 and DYS434. The rest match this haplotype exactly or have single 1-step mutations. [1] When this Central Asian R1b haplotype is compared with the other Caucasian samples, a mixed picture emerges, with the poorest being an Armenian (arm47) at 8/16, whereas the best are another Armenian (arm12) and Azeri (az48), both at 15/16. [1]
One interesting point is the Kurds sampled in this study (some of whom also belong to R1b-M269) are actually the displaced population positioned on the Iranian-Turkmenistani border. All of whom match the Central Asian R1b haplotype with a similar value (12-13/16). This definitively rules out the Kurds as a source for the haplotype, particularly as better matches can be found further to the west. It should be noted the Kurds themselves formed their own R1b haplotype (defined here by DYS389II=27, DYS391=10). [1]

In summary, the data reveals that the Turkmen are particularly abundant in R1b-M269 and all belong to the same haplotype as one of the Uzbek samples. This haplotype matched some Caucasians very well, but others not so well. The Kurds living in Turkmenistan belonged to their own haplotype.


3ii. Is This Actually R1b-M269?

Attention must first be shown to the original paper again; any potential R1b-M269 here will be present as P(xR1a)-92R7 (shown in the paper as "Haplogroup 1"). [1] Evidently, this makes up approximately half of the Turkmen lines and a quarter of Uzbek ones. Other haplogroups (such as other forms of R1b, R2a-M124, various Q subclades) presumably make up the rest of "Haplogroup 1" shown.

The next step is to verify whether or not this Central Asian R1b haplotype matches other R1b haplotypes online. As Y-DNA R1b-M269 is fortunately well-represented in the world of genetic genealogy, searching for the haplotype's matches on ySearch is a reasonable enterprise. DYS437 had to be excluded here due to a conversion issue, leaving the haplotype at 15 STR's. A genetic distance (GD) of 3 was allowed on these 15 markers. Results are shown on the right.

ySearch results for Central Asian R1b haplotype
With some confidence, the search has demonstrated that the Central Asian R1b haplotype does indeed belong to R1b-M269, as all the seven matches shown (one of whom is Armenian) belong to it.

Expanding the line of inquiry one further step came through comparing this haplotype with Iranian haplotypes [2] which were readily available. Due to differences in STR panels (an overlap of only 11) this proved to be inconclusive, aside from the observation that DYS389i+ii was completely different between the Central Asian modal (10-26) and the Iranian values. At this point I suspect that, much like DYS437, there is a conversion issue with DYS389 also.

Finally, a comparison was made with the R1b found in Afghanistan last year [3]. Interestingly, if DYS389i+ii and DYS437 are excluded, the two Uzbeks (samples 35 and 181) match the Central Asian R1b haplotype almost exactly based on the remaining 11 STR's. The one Tajik (sample 32) is less likely to be related due to two 1-step mutations on different STR's.


4. Conclusion

The inferences made from the data hang by a metaphorical thread due to the persistent STR issue; different labs have used different panels in the past decade, making it excruciatingly difficult to use materials from older papers. Fortunately, the presence of a specific strain of R1b-M269 in Central Asian (in Turkmen and Uzbeks) has successfully been demonstrated after select exclusions and no modifications to the data.

However, some larger questions remain. If STR limitations were not an issue, how would the Iranians from Haber et al. have compared? Would the Tajik from the other Haber et al. paper have belonged to the same haplotype in the end?

The origin of this Central Asian R1b haplotype will, I anticipate, also be a point discussed heavily among interested parties. At this point in time, I must stress that none of the evidence thus far points to anything in particular without ruling other theories out, although it leaves the door for interpretation wide open.

Having given this cautionary statement, the main thrust of this entry should be emphasised; R1b-M269 in Central Asia is a confirmed reality and here to stay. I will defer any subsequent analyses to the experts on Y-DNA R1b which grace several genetic genealogy boards for their take on the flavour of this haplotype.


5. Acknowledgement

I publicly extend my gratitude to Dr. Tyler-Smith for being so kind in sending me the raw STR's from this important paper for my research, as well as co-authoring the other two excellent studies I have cited here and in the past.


6. References

1. Zerjal T, Wells RS, Yuldasheva N, Ruzibakiev R, Tyler-Smith C. A genetic landscape reshaped by recent events: Y-chromosomal insights into central Asia. Am J Hum Genet. 2002 Sep;71(3):466-82. Epub 2002 Jul 17.

2. Haber M, Platt DE, Badro DA, Xue Y, El-Sibai M, Bonab MA. Influences of history, geography, and religion on genetic structure: the Maronites in Lebanon. Eur J Hum Genet. 2011 Mar;19(3):334-40. doi: 10.1038/ejhg.2010.177. Epub 2010 Dec 1.

3. Haber M, Platt DE, Ashrafian Bonab M, Youhanna SC, Soria-Hernanz DF, Martínez-Cruz B. Afghanistan's ethnic groups share a Y-chromosomal heritage structured by historical events. PLoS One. 2012;7(3):e34288. doi: 10.1371/journal.pone.0034288. Epub 2012 Mar 28.

Tuesday, March 26, 2013

Y-DNA Haplogroup N in India: Wayward Uralics or Lab Error? [Original Work]

Introduction
Y-DNA Haplogroup N Eurasian Distribution


Per ISOGG's 2013 SNP tree and as has been the case for years, Y-DNA Haplogroup N is defined by the M231 mutation (G->A at rs9341278) on the Y-Chromosome. With a predominantly North Eurasian distribution, it peaks in Europe among the Finnish people and various ethnic groups residing in Russia's far north through the N1c-Tat subclade. N1c-Tat specifically is frequently associated with Uralic-speaking populations in the literature.

Haplogroup N also appears to have an association with Central Asia as shown in the N Y-DNA Haplogroup Project (FTDNA) results, with several samples coming in from Kazakhstan, Uzbekistan and Mongolia. It has also been observed in Turkey (KurdishDNA blog entry) as well as appearing in 1.6% of Iran's Azeri population (Grugni et al. entry).

The finding of Haplogroup N in India through Sharma et al.'s The Indian origin of paternal haplogroup R1a1* substantiates the autochthonous origin of Brahmins and the caste system [1] is a curious one. Unfortunately, the paper did not include any Y-STR material to help understand the basis of N's presence in India.


Significance of Potential Haplogroup N in India

Linguistics provides us with a plausible scenario regarding how Haplogroup N may have arrived in the Indian Subcontinent. Contacts between early Finno-Ugric and Indo-Iranian groups took place around the Ural mountains, specifically between the forest and steppe zones. Evidence of transmission in horsekeeping techniques, economy, deities and common words are firmly established from Andronovo archaeological horizon on the steppes into the "Andronovoid" societies living in the nearby forests. [2]

The presence of Haplogroup N in India, if present in relevant populations and displaying MRCA values or STR clusters consistent with a Neolithic origin further north, would satisfy the likelihood of Haplogroup N representing an accompanying genetic signal from the steppe zone roughly four thousand years ago, as well as serving as a genetic remnant of the interactions that undoubtedly took place between Indo-Iranian and Finno-Ugric tribes.


Current Findings

In 2009, Sharma et al. published a paper highlighting the Y-Chromosome haplogroup differences between various upper caste (Brahmin) and tribal populations across India. The paper went on to deduce that Haplogroup R1a1a in India was autochthonous in origin based on their findings [1] (now disputable and improbable based on Underhill et al.'s landmark study on Y-DNA R1a1a and recent findings by the R1a Subclades FTDNA Project, although this topic is beyond the scope of this entry).

It was this very paper by Sharma et al. which revealed the presence of Y-DNA N in India. Haplogroup N1-LLY22g was found in Brahmins from Gujarat, Madhya Pradesh and Mahastra (3.13%, 2.38% and 3.33% respectively), as well as tribal populations from Uttar Pradesh (1.56%). Their results were extended to include greater caste differentiation (Brahmins vs. Scheduled Castes vs. Tribals); here, Brahmins were found to have five times greater the frequency of N1-LLY22g than tribal groups (0.5% vs. 0.1% respectively).  [1]

Although the frequencies were arguably insignificant, the inference stood - Y-DNA Haplogroup N showed an association with the upper caste practitioners of Hinduism in India, paving the way for the scenario described in the above chapter to be considered.

However, the strength of this conclusion is weakened greatly by cross-sectional data from numerous studies concerning the Indian Subcontinent produced in the past decade:


  • Sengupta et al. (2006) revealed that, out of 1090 samples, with the majority coming from the Indian Subcontinent, the only populations revealing any Haplogroup N (N-M231) and associated downstream subclades were either East Asian (Chinese ethnicities, Cambodian) or Siberian (Yakut). [3] No groups from India belonged to Haplogroup N-M231.
  • Furthermore, Sahoo et al. (2006) also sampled individuals from across the Indian Subcontinent (n=1074) and failed to find a single instance of N-M231. [4]
  • In a recent study on various populations in Tamil Nadu (South India), Haplogroup N was completely absent in the 1680 samples tested. [5]
  • Y-DNA N1c-Tat was absent in the 607 tribal populations tested from East and Northeast India. [6]
  • Returning to the north of the country, 560 men from various upper castes and Muslim groups were tested by Zhao et al. and N1c-Tat was absent from all. [7] 
  • Focused specifically on Brahmins from Saraswat (Jammu-Kashmir), Yadav et al. found none of the approximately 109 haplotypes to belong to any derivative of Haplogroup N. [8]

Finally, the N Y-DNA Haplogroup Project at FTDNA currently does not show any samples whatsoever from the Indian Subcontinent.


Possible Explanation

Despite over 4,000 samples over five studies representing various groups from across India, not a single trace of Haplogroup N has been detected. What explains this glaring discrepancy with Sharma et al.'s findings? Differences in sampling strategy between the other studies with Sharma et al. cannot account for this; there is enough regional overlap to rule this out.

As was the case with Sengupta et al. where several Hazara haplogroup classifications were allegedly due to a laboratory error, it is probable the Haplogroup N seen here follows the same suit. By reasonable deduction, if one study reveals a trend that several others covering thousands of samples cannot verify, there must be something intrinsically erroneous in the former.


Conclusion

Until I can physically view the purported Haplogroup N haplotypes reported in Sharma et al., it is the conclusion of this entry that they are most likely the result of a laboratory error given the complete absence of any flavour of N-M231 in India through other recent studies. If any Haplogroup N is found, it must be contrasted against Sharma et al. and should be investigated on a separate line of inquiry. As ever, details of any future cases of Haplogroup N in India should be taken into consideration. If of a Mughal background, the paternal origins are readily explained by Medieval Central Asian ancestry. If from the furthest northeast of the Indian Subcontinent, the possibility of Nepali ancestry should be sought. [9] Although prehistoric indirect influence from Finno-Ugric interactions in the second millennium BC onwards shouldn't be dismissed outright, other more recent explanations exist.


References


1. Sharma S, Rai E, Sharma P, Jena M, Singh S, Darvishi K. The Indian origin of paternal haplogroup R1a1* substantiates the autochthonous origin of Brahmins and the caste system. J Hum Genet. 2009 Jan;54(1):47-55. doi: 10.1038/jhg.2008.2. Epub 2009 Jan 9.

2. Kuz'mina EE. The Origin of the Indo-Iranians. Koninklijke Brill NV, Leiden, The Netherlands. 2007.

3. Sengupta S, Zhivotovsky LA, King R, Mehdi SQ, Edmonds CA, Chow CE. Polarity and temporality of high-resolution y-chromosome distributions in India identify both indigenous and exogenous expansions and reveal minor genetic influence of Central Asian pastoralists. Am J Hum Genet. 2006 Feb;78(2):202-21. Epub 2005 Dec 16.

4. Sahoo S, Singh A, Himabindu G, Banerjee J, Sitalaximi T, Gaikwad S. A prehistory of Indian Y chromosomes: evaluating demic diffusion scenarios. Proc Natl Acad Sci U S A. 2006 Jan 24;103(4):843-8. Epub 2006 Jan 13.

5. Arunkumar G, Soria-Hernanz DF, Kavitha VJ, Arun VS, Syama A, Ashokan KS. Population differentiation of southern Indian male lineages correlates with agricultural expansions predating the caste system. PLoS One. 2012;7(11):e50269. doi: 10.1371/journal.pone.0050269. Epub 2012 Nov 28.

6. Borkar M, Ahmad F, Khan F, Agrawal S. Paleolithic spread of Y-chromosomal lineage of tribes in eastern and northeastern India. Ann Hum Biol. 2011 Nov;38(6):736-46. doi: 10.3109/03014460.2011.617389. Epub 2011 Oct 6.

7. Zhao Z, Khan F, Borkar M, Herrera R, Agrawal S. Presence of three different paternal lineages among North Indians: a study of 560 Y chromosomes. Ann Hum Biol. 2009 Jan-Feb;36(1):46-59. doi: 10.1080/03014460802558522.

8. Yadav B, Raina A, Dogra TD. Genetic polymorphisms for 17 Y-chromosomal STR haplotypes in Jammu and Kashmir Saraswat Brahmin population. Leg Med (Tokyo). 2010 Sep;12(5):249-55. doi: 10.1016/j.legalmed.2010.05.003.

9. Gayden T, Chennakrishnaiah S, La Salvia J, Jimenez S, Regueiro M, Maloney T. Y-STR diversity in the Himalayas. Int J Legal Med. 2011 May;125(3):367-75. doi: 10.1007/s00414-010-0485-x. Epub 2010 Jul 21.