Showing posts with label Y-STR. Show all posts

Tuesday, July 28, 2015

Comparison of Online Y-STR Predictors (Petrejcíková et al.) [Review]

Introduction
An interesting study was published in 2014 based on Slovak Y-STR samples testing for 12 microsatellite markers. The main scope of this paper appears to be the investigation of the efficacy of three publicly available Y-STR haplogroup predictors (Athey, Cullen and YPredictor in alphabetical order) based on these 12 Y-STRs. Study contents shown below.

Y-SNP analysis versus Y-haplogroup predictor in the Slovak population.
Petrejcíková E, Carnogurská J, Hronská D, Bernasovská J, Boronová I, Gabriková D, Bôziková A, Maceková S. Anthropol Anz. 2014;71(3):275-85.
Human Y-chromosome haplogroups are important markers used mainly in population genetic studies. The haplogroups are defined by several SNPs according to the phylogeny and international nomenclature. The alternative method to estimate the Y-chromosome haplogroups is to predict Y-chromosome haplotypes from a set of Y-STR markers using software for Y-haplogroup prediction. The purpose of this study was to compare the accuracy of three types of Y-haplogroup prediction software and to determine the structure of Slovak population revealed by the Y-chromosome haplogroups. We used a sample of 166 Slovak males in which 12 Y-STR markers were genotyped in our previous study. These results were analyzed by three different software products that predict Y-haplogroups. To estimate the accuracy of these prediction software, Y-haplogroups were determined in the same sample by genotyping Y-chromosome SNPs. Haplogroups were correctly predicted in 98.80% (Whit Athey's Haplogroup Predictor), 97.59% (Jim Cullen's Haplogroup Predictor) and 98.19% (YPredictor by Vadim Urasin 1.5.0) of individuals. The occurrence of errors in Y-chromosome haplogroup prediction suggests that the validation using SNP analysis is appropriate when high accuracy is required. The results of SNP based haplotype determination indicate that 39.15% of the Slovak population belongs to R1a-M198 lineage, which is one of the main European lineages.
[Abstract] [Direct Link]

Are They Really Comparable?
Although all three predictors returned similar efficacy rates (~97-99%), it should be noted the authors' chief divisions of interest appear to be the conventional subclade designations currently used in both literature and the genetic genealogy community (e.g. R1a1a-M198). The authors correctly state Y-SNP testing is paramount in definitively gauging subclade classifications, especially for lines substantially downstream of a given haplogroup's phylogeny.

The rest of this entry determines whether these calculators display any other features which may give aspiring researchers reasons to choose one over another.

Subclade Coverage
A substantial difference is observed between the three. Athey's output is oriented around 21 categories spread across most of the major clades/subclades, although haplogroups not commonly found in West Eurasia (e.g. A-D) are unrepresented. Cullen improves on this significantly with 86 subclades, with Y-DNA I receiving the most attention (R1b to a lesser extent), with some improvements, such as well as the inclusion of "A&B". YPredictor has the highest count, hosting over 100 subclades, with the majority found in Y-DNA haplogroups E, G, J, N and R. With the exception of Y-DNA M and S, all are accounted for here.

STR count
Athey is capable of handling 111 Y-STR's (21 and 27-STR versions also available) with the format being listed in either numerical or Family Tree DNA (FTDNA) order. Cullen accepts a maximum of 67 STR's. YPredictor houses approximately 82 STR's. As such, all three are capable of handling a considerable number.

Interface
All three predictors permit the use of batched data and provide different means of categorising the data as seen fit by the user. Instructions are adequately provided for all three as well. As a research utility, however, YPredictor stands out through its' custom YFiler iterations (widely-used format in population genetics publications concerning Y-STRs) and debug feedback before predictions are made by the calculator.

Computational Time
This varies based on the user's CPU processing time, as well as whether they are manually entering STR values or inserting batched data. As such, this probably shouldn't be a pertinent factor in deciding which calculator to use.

Output Information
All three produce similar information (subclade prediction with probability expressed as a percentage).

Conclusion
Before summarising these findings, it is worth noting that Athey's predictor precedes Cullen's and YPredictor. As such, any perceived deficiencies in subclade breakdown or functionality are likely a result of age. Athey's predictor was widely used in the past, irrespective of the current application rate.

All three predictors are of use to genetic genealogists. This entry concludes the following "idealised" purposes for each:

  • Athey - For users keen to utilise upwards of 111 FTDNA Y-STR's as cross-validation against the other two
  • Cullen - Best for those seeking refined Y-DNA I or R1b subclade predictions
  • YPredictor - Most versatile and research-friendly, best worldwide coverage of Y-DNA subclades

As such, the three calculators certainly are comparable for making basic Y-STR predictions for West Eurasians, but obvious differences exist with respect to non-West Eurasian subclade coverage.

If compelled to make a single choice, I would recommend Cullen first to genetic genealogists of Northwest European paternal heritage (given the high frequencies of Y-DNA's I and R1b). YPredictor would be the best choice for those belonging to subclades more common outside Europe. This also explains why it has been extensively used in this blog to date. Athey's function has otherwise been usurped by the other two. 

Thursday, July 9, 2015

Presenting Bakhtiari Uniparental Marker Data [Original Work]

Introduction
Bakhtiari people (Google Search)
The Bakhtiari people are one of Iran's ethnic minorities. Inhabiting the Iranian plateau's southwestern portion, the Bakhtiari traditionally maintained a hierarchical social structure with a genealogical basis (with organisations or positions including rish safids, kalantars, khans and ilkhani) [1]. Historically, the Bakhtiari have played a role in several pivotal events leading up to the formation of the modern Iranian state [2].

In recent years, the Bakhtiaris have received additional attention in the literature with respect to ancestry. This has been achieved predominantly via uniparental markers (Y-DNA and mtDNA) and coincides with work addressing the genetic origins of other ethnic minorities in Iran. For instance, in 2012, Grugni et al. expanded our understanding of Iranian Y-DNA across the country through sampling almost 1,000 unrelated men across 15 distinct ethnic groups (previous entry).

In spite of such developments, however, the Bakhtiari have not received much attention in either the genetic genealogy community or the literature. This entry attempts to explore the available data and arrive at a stable set of results for this group.

Method
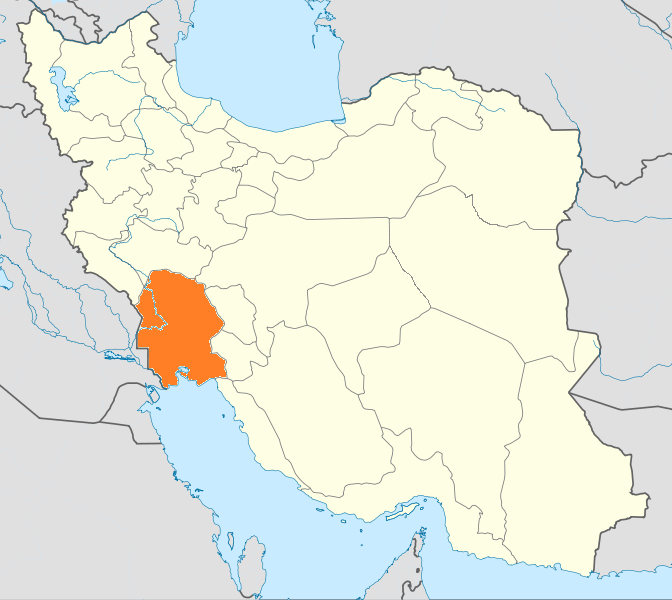
Khuzestan province, Iran (Wikipedia)

Search engines were limited to PubMed and Google Translate. Search terms included "Bakhtiari", "Y-DNA", "Y-Chromosome", "mtDNA", "mitochondrial", "STR", "SNP", "HVR" and "Iran". No limit was placed on publication date. All mtDNA and Y-DNA data was compiled. Where Y-STRs are presented, these were run through Vadim Urasin's YPredictor (v1.0.3 offline version). A 70% prediction strength threshold was implemented. If the resulting data is sparse, novel ways of consolidating the information will have to be devised and explained during the course of this entry.

Search Outcomes
Three studies were found to contain Bakhtiari uniparental data, with one partially covering Bakhtiari mtDNA (Derenko et al. 2013 [3]) and two for Y-DNA (Nasidze et al. 2008 [4], Roewer et al. 2009 [5]). The Bakhtiari populations featured mostly reside in Izeh, Khuzestan province, Iran [3-5] with a single sample coming from Lurestan province, Iran [4].

mtDNA Results
Derenko et al. featured only two Bakhtiari samples. One belonged to mtDNA H*, which was also observed in several Persian (Kerman province) and Qashqai samples, alongside a single Armenian. [3] The only other sample was mtDNA U2d2, also found in a single Persian (Kerman province). The authors noted that the combined frequency of mtDNA's U2c and U2d in Iran were highest among the Persians nationwide (approaching 10%) [3]. However, given the absence of additional samples, no reasonable conclusions can be drawn from these results.

Nasidze et al. provides both frequency and HVR1 derived variance data on the Bakhtiari and Ahwazi Arab populations [4]. The Bakhtiari appear to chiefly belong to mtDNA haplogroups N, U, H, T and J (below).

mtDNA Frequency Data from Khuzestan province, Iran {Nasidze et al. 2008)

Unfortunately, further information on subclade breakdown is not provided. However, as concluded by the authors and is evident through frequency data, the mtDNA profile of the Bakhtiari is almost identical to the Ahwazi Arab sample. Additionally, Nasidze et al. note "considerable sharing of HV[R]1 sequences" between these two groups [4]. In tandem with the inferences described above through Derenko et al., it appears that significant matrilineal marker overlap does exists across the Iranian plateau.

Y-DNA Results
Nasidze et al. first published data on 53 unrelated Bakhtiari men [4]. Due to substandard Y-SNP genotyping, the only conclusions that may broadly be discerned is the Bakhtiari chiefly belong to Y-DNA haplogroups J2-M172 (25%) and G-M201 (15%) (Data Sink). In this respect, these results cannot give observers a reliable indication of the Bakhtiari Y-DNA profile. Roewer et al.'s data indicates that some number of Bakhtiari do share the same core 17 STR haplotypes among one another (e.g. J2a4, T*)  but do not with any other samples across the country [5].

One "quick and dirty" way of addressing this problem is by using the YFiler (17 STR) Bakhtiari haplotypes (Data Sink) from Roewer et al. to "recharacterise" the Nasidze data. This is deemed the most suitable option for two reasons:
1) Nasidze et al. has an adequate sample size (n=53) but inadequate Y-SNP genotype selection
2) Roewer et al. has an inadequate sample size (n=18) and no confirmed Y-SNP testing, but the YPredictor data should provide reasonable subclade determination with a 70% probability threshold in place

"Recharacterisation" is achieved by expressing the Nasidze et al. data by the predicted subclade information provided by the Roewer et al. SNP predictions proportionally. For example, Nasidze et al. found "DE-YAP" at 8%, with the Roewer et al. predicted results showing 5.6% each for "DE*" and "E1b1b1". As both these subclades are contained within the DE-YAP node, the original value is recharacterised as DE 4% and E1b1b1 4%. The outcome is presented numerically (Data Sink) and demonstrated below (values rounded down to fit to 100%):


Y-DNA J2a4 constitutes the largest subclade (22.1%), with H (10.8%), R1a1a (8.9%) and T* (8.5%) following. The results imply considerable Y-SNP diversity within the Izeh Bakhtiari.

These results are somewhat at odds with that suggested by the Roewer et al. figures, particularly the frequency of Y-DNA J2-M172 (50% in Roewer et al. vs. 25% in Nasidze et al.). The most likely basis for this is sampling bias, given the former only tested for 18 individuals. It should be noted that Y-DNA J-12f2 has been documented to have a major (>60%) presence in Southwestern Iran (Quintana-Murci et al. 2001) with the majority of this likely being represented by downstream J2-M172 subclades (as per Grugni et al. 2012). It is therefore plausible for some Bakhtiari groups to yield exceptionally high frequencies of Y-DNA J2-M172 (likely J2a4 subclade) with future testing. The breakdown shown above is also broadly in line with past data from Southwestern Iran (Grugni et al. 2012).

It must be cautioned that literal interpretation of these results (both subclade breakdown and numbers) are not advised due to the inaccuracies brought by the "recharacterisation" and the lack of Y-SNP confirmation in Roewer et al.

It should also be emphasised that, as a tribal group, the Bakhtiari have most likely undergone genetic drift in their uniparental markers over time. As such, the finding of ~10% Y-DNA H is not completely surprising. Whether these values will be substantiated in future work is an open question.

Conclusion
The current evidence does suggest that the Bakhtiari closely resemble and share heritage with their immediate neighbours matrilineally, resting upon a backdrop of some common mtDNA diversity across the Iranian plateau. Inferences beyond this point will fall towards the realm of speculation.

The situation appears somewhat inverted on the Y-DNA side, where non-existent Y-STR haplotype sharing is observed with other groups in the Iranian plateau. The "recharacterised" data gives us an approximate idea of what the Bakhtiari Y-DNA profile should look like if Nasidze et al. used a better Y-SNP genotype panel.

Other ethnic minorities in Iran have received consistent attention in this respect, such as the neighbouring Qashqai and Lurs (Farjadian et al. 2011). The paucity in Bakhtiari uniparental marker data indicates this is very much an area that needs immediate attention. An initial first direction for researchers is to sample at least 50 unrelated individuals from Izeh using a more conventional Y-SNP genotype panel. Additional clarity will be gained by testing further areas, as well as reconciling the Bakhtiari tribal structure with these outcomes.

Acknowledgements
A very special thanks to the user "J Man" from Anthrogenica for bringing this interesting topic to my attention.

[Edit 10/07/2015]: I have also learned while researching this topic that Dr. Ivan Nasidze unfortunately passed away in 2012. His work served as an important early foundation towards understanding the genetic constitution of Caucasian and Iranian populations. May he rest in peace.

References
1. Bakhtiari. Last Accessed 25/06/2015: http://www.everyculture.com/Africa-Middle-East/Bakhtiari.html

2. Study of the Qajar government policy at the case of Household Bakhtiari. Last Accessed 6/07/2015: http://waliaj.com/wp-content/2014/Issue%201,%202014/26%202014-30-1-pp.124-127.pdf 

3. Derenko M, Malyarchuk B, Bahmanimehr A, Denisova G, Perkova M, Farjadian S. Complete mitochondrial DNA diversity in Iranians. PLoS One. 2013 Nov 14;8(11):e80673. doi: 10.1371/journal.pone.0080673. eCollection 2013.

4. Nasidze I, Quinque D, Rahmani M, Alemohamad SA, Stoneking M. Close genetic relationship between Semitic-speaking and Indo-European-speaking groups in Iran. Ann Hum Genet. 2008 Mar;72(Pt 2):241-52. doi: 10.1111/j.1469-1809.2007.00413.x. Epub 2008 Jan 20.

5. Roewer L, Willuweit S, Stoneking M, Nasidze I. A Y-STR database of Iranian and Azerbaijanian minority populations. Forensic Sci Int Genet. 2009 Dec;4(1):e53-5. doi: 10.1016/j.fsigen.2009.05.002. Epub 2009 Jun 5.

Friday, September 5, 2014

Worldwide Population Y-DNA Collated (Xu et al.) [Review]

Approximately one week has passed since a new paper by Xu et al. was indexed by PubMed and made available online ahead of printing:

"The Y chromosome is one of the best genetic materials to explore the evolutionary history of human populations. Global analyses of Y chromosomal short tandem repeats (STRs) data can reveal very interesting world population structures and histories. However, previous Y-STR works tended to focus on small geographical ranges or only included limited sample sizes. In this study, we have investigated population structure and demographic history using 17 Y chromosomal STRs data of 979 males from 44 worldwide populations. The largest genetic distances have been observed between pairs of African and non-African populations. American populations with the lowest genetic diversities also showed large genetic distances and coancestry coefficients with other populations, whereas Eurasian populations displayed close genetic affinities. African populations tend to have the oldest time to the most recent common ancestors (TMRCAs), the largest effective population sizes and the earliest expansion times, whereas the American, Siberian, Melanesian, and isolated Atayal populations have the most recent TMRCAs and expansion times, and the smallest effective population sizes. This clear geographic pattern is well consistent with serial founder model for the origin of populations outside Africa. The Y-STR dataset presented here provides the most detailed view of worldwide population structure and human male demographic history, and additionally will be of great benefit to future forensic applications and population genetic studies."

This paper showcases a staggering 979 distinct Y-DNA 17 STR haplotypes across 44 distinct populations from across the world. These haplotypes are soon to be uploaded to the Y-STR Haplotype Resource Database (YHRD). The authors have made all the haplotypes, together with a slew of additional information, publicly available independent of the official article (raw haplotypes, Y-DNA haplogroup predictions).

In this entry, the collated results of all populations are reviewed, together with cursory inferences provided with the intention of aiding interpreting them.


Method
All 979 haplotypes were retrieved through the above link. Each population dataset was run through Vadim Urasin's YPredictor (v1.5.0). A 70% prediction strength threshold was implemented. All nomenclature were reduced to the haplogroup level to avoid confusion for future readers should these change in time. These haplotypes formed the collated population results.


Results
877 haplotype predictions met the 70% threshold established. Without having access to the original study, it is apparent that the authors also used Urasin's YPredictor, given the identical predictions.

The collated population results have been organised by the location of sampling by continent or region and can be found in the Data Sink. Direct links to each section accompanied by the list of populations sampled are listed below for the reader's convenience with a brief runthrough of some interesting findings under each.

1. Europe Adygei (Russia), Chuvash (Russia), Danes (Denmark), Finns (Finland), Hungarians (Hungary), Irish (Ireland), Khanty (Russia), Komi (Russia), Russians (Archangelsk), Russians (Vologda), Yakut (Russia)

The Adygei present as expected; they are predominantly G-P15 and J-L26 with various subclades of haplogroup R. Various subclades of haplogroups N and R define the Chuvash, with an additional appearance by J-L26 and Q-MEH2. Ethnic Russian populations appear to have their own regionalised diversity on the backdrop of being predominantly R-M198 and downstream subclades (particularly R-M458). The Irish are predominantly (~81%) R-M269, although the presence of a single man with H-M82 is surprising. Finally, the Yakut too belong overwhelmingly to haplogroup N (~78%) with a single man being predicted as I-P37.2.

2. Middle-East Druze (Israel), Samaritans (Israel), Yemenite Jews (Yemen)

The Druze are one of the better-sampled populations in this study, where they are mostly represented by various subclades of haplogroups E and G, together with R-M269 and T-L162. The Samaritans are defined (in order of decreasing frequency) exclusively by J-L26, J-P58 and E-V22. Finally, the Yemenite Jews present with a similar (though more restricted) spectrum as the Druze with some differences in frequency.

3. East Asia Ami (Taiwan), Atayal (Taiwan), Cambodians (Cambodia), Chinese (USA), Chinese (Taiwan), Hakka (Taiwan), Japanese (USA), Koreans (S. Korea), Laotians (Laos)

The Ami are unsurprisingly defined mostly by downstream subclades of haplogroup O, although there does appear to be an I-M223 and L-M317 among them. The Atayal, also of Taiwan, are exclusively O-MSY2.2. The Cambodians appear to have even more lineages which are typically expected further west. The Japanese boast the highest frequency of D-M55 out of all the populations sampled (21.1%). The Korean results contrast with this through the presence of men with N*-LLY22g(xM128,P43,Tat) and Q-MEH2. The Laotians appear to have one man with DE*-M1, although this will require SNP testing to definitively confirm.

4. Africa Ashkenazi Jews (S. Africa), Biaka Pygmies (CAR), Chagga's (Tanzania), Ethiopian Jews (Ethiopia), Hausa (Nigeria), Ibo (Nigeria), Masai (Tanzania-Kenya), Mbuti Pgymies (Congo R.), Sandawe (Tanzania), Yoruba (Nigeria)

The Ashkenazi Jews of South Africa appear to have a Y-DNA spectrum that is completely typical of Southwest Asians (please compare with the Druze). The Bagandu are largely defined by subclades of haplogroups B and E. Tanzanians here are completely haplogroup E and T. The presence of G-M15, J-L26 and R-M269 among the Hausa is surprising and may be attributed to a colonial European presence or some other forms of interaction.  The Sandawe have some rather unusual results given their geographical position (I-P37.2 and Q-MEH2), raising the possibility these haplotypes were predicted incorrectly.

5. Australasia Micronesians (Micronesia), Nasioi Melanesians (Solomon Islands)

Both the Micronesians and Melanesians have an unusually diverse spectrum. It is difficult to ascertain whether the parahaplogroups shown are genuine or, as described above, a result of incorrect predictions. A recent paper revealing the presence of newly discovered offshoots from haplogroup K in Southeast Asia [1] raise the possibility some of these may be genuine.

6. Americas Karitiana (Brazil), African Americans (USA), European Americans (USA), Maya (Mexico), Pima (USA), Rondonian Surui (Brazil), Ticuna (Brazil)

The Karitiana are predominantly Q-MEH2 but appear to have some non-American admixture through E-U175. African Americans are represented as an approximately 4:6 mix of R-M269 against various haplogroup E subclades. The Maya population, like the Karitiana, are Q-MEH2 with additional markers from outside the Americas, as are the Pima. The trend continues with the Quechua people, although C-M217 and T-L162 make their first appearance here. Finally, the Rondonian Surui and Ticuna are completely Q-MEH2.


Criticisms
There are at least two areas of the authors' methodology which are deemed to be drawbacks and prevent this study from being exceptionally informative.

Firstly, the authors evidently used the YFiler sampling array to complete this investigation. In an era where commercial testees can enjoy upwards of 111 Y-STR's, the long-term usefulness of this paper's extensive worldwide sampling is cut short. Another recent paper presenting Y-STR's worldwide has done so using 23 rather than just 17. [2]

My comments are more critical of the authors' sampling strategy. More data is never strictly a burden in the world of population genetics, but the informativeness of groups such as "European Americans", "Irish" and Chinese born in the USA is questionable. For instance, these groups are already richly represented, be it in the current literature or FTDNA Project groups. The apparent issue with these samples would have been rectified if they were simply obtained from a single area, providing regional specificity which may prove useful in better establishing genetic variation within Ireland, for example.

Finally, the haplotypes could have also received a "backbone" SNP test each to definitively place them within the current phylogeny. The drawbacks of STR-alone testing became readily apparent with some of the African samples. I can only speculate it is the highly divergent nature of certain uniquely African haplotypes from Eurasian ones which produced these spurious results.


On Mutation Rates (Quick Discussion)
In this study, both BATWING and the average squared distance (ASD) method were used. Within each, four different mutation rates were implemented. On initial inspection these appear to vary wildly. However, on closer examination, it appears all the BATWING most recent common ancestor (MRCA) calculated ages are approximately twice as old as those generated by the ASD method. Even within each technique there is substantial variation; the evolutionary rate appears approximately three times greater than the others. Furthermore, these "other" mutation rates do tend to congregate around a common similar value (e.g. through BATWING, the calculated global age of their Y-DNA R-M198 haplotypes was 5.5k, 6.1k and 6.2kya), which would intuitively suggest the "actual" value lies somewhere within these either through BATWING or ASD. The discrepancy here cannot be overstated and calls into question why some researchers are still utilising a "blanket" mutation rate across several loci which are shown to have significantly different tendencies to mutate (colloquially described as "slow", "medium" and "fast" mutators). I am uncertain whether the authors are in fact doing this, but the implications of this are apparent, as they prevent rational "fitting" of these numbers into candidate prehistoric narratives from happening. This entire topic will likely be explored in a future entry.


Conclusion
Although at least three drawbacks (four including the MRCA calculations) are identified here, this study provides researchers worldwide with a plethora of data from populations that are either poorly represented in the current literature or have been entirely absent until present. The majority of the results outline the wide Y-chromosomal diversity across the world, whilst also revealing specific trends that have been established in both the current literature and in online discussion boards. An mtDNA counterpart of this paper would be a wonderful addition to see sometime in the near future.

There is a bountiful amount of data to be interpreted with pre-existing ideas/models and compared with prior studies which place a premium on each population's area. I welcome any form of dialogue regarding the results. There, is, for many of us, plenty to elucidate. The conclusion does not end here; I encourage as much further investigation and thought by the readers as the data permits.

[Addendum @ 05/09/2014]: Error regarding Karitiana data. Modified and updated.


Citations
1. Karafet TM, Mendez FL, Sudoyo H, Lansing JS, Hammer MF. Improved phylogenetic resolution and rapid diversification of Y-chromosome haplogroup K-M526 in Southeast Asia. [Last Retrieved 03/09/2014]: http://www.nature.com/ejhg/journal/vaop/ncurrent/full/ejhg2014106a.html 

2. Purps J, Siegert S, Willuweit S, Nagy M, Alves C, Salazar R et al. A global analysis of Y-chromosomal haplotype diversity for 23 STR loci. [Last Retrieved 05/09/2014]: http://www.fsigenetics.com/article/S1872-4973%2814%2900084-2/abstract

Tuesday, March 26, 2013

Y-DNA Haplogroup N in India: Wayward Uralics or Lab Error? [Original Work]

Introduction
Y-DNA Haplogroup N Eurasian Distribution


Per ISOGG's 2013 SNP tree and as has been the case for years, Y-DNA Haplogroup N is defined by the M231 mutation (G->A at rs9341278) on the Y-Chromosome. With a predominantly North Eurasian distribution, it peaks in Europe among the Finnish people and various ethnic groups residing in Russia's far north through the N1c-Tat subclade. N1c-Tat specifically is frequently associated with Uralic-speaking populations in the literature.

Haplogroup N also appears to have an association with Central Asia as shown in the N Y-DNA Haplogroup Project (FTDNA) results, with several samples coming in from Kazakhstan, Uzbekistan and Mongolia. It has also been observed in Turkey (KurdishDNA blog entry) as well as appearing in 1.6% of Iran's Azeri population (Grugni et al. entry).

The finding of Haplogroup N in India through Sharma et al.'s The Indian origin of paternal haplogroup R1a1* substantiates the autochthonous origin of Brahmins and the caste system [1] is a curious one. Unfortunately, the paper did not include any Y-STR material to help understand the basis of N's presence in India.


Significance of Potential Haplogroup N in India

Linguistics provides us with a plausible scenario regarding how Haplogroup N may have arrived in the Indian Subcontinent. Contacts between early Finno-Ugric and Indo-Iranian groups took place around the Ural mountains, specifically between the forest and steppe zones. Evidence of transmission in horsekeeping techniques, economy, deities and common words are firmly established from Andronovo archaeological horizon on the steppes into the "Andronovoid" societies living in the nearby forests. [2]

The presence of Haplogroup N in India, if present in relevant populations and displaying MRCA values or STR clusters consistent with a Neolithic origin further north, would satisfy the likelihood of Haplogroup N representing an accompanying genetic signal from the steppe zone roughly four thousand years ago, as well as serving as a genetic remnant of the interactions that undoubtedly took place between Indo-Iranian and Finno-Ugric tribes.


Current Findings

In 2009, Sharma et al. published a paper highlighting the Y-Chromosome haplogroup differences between various upper caste (Brahmin) and tribal populations across India. The paper went on to deduce that Haplogroup R1a1a in India was autochthonous in origin based on their findings [1] (now disputable and improbable based on Underhill et al.'s landmark study on Y-DNA R1a1a and recent findings by the R1a Subclades FTDNA Project, although this topic is beyond the scope of this entry).

It was this very paper by Sharma et al. which revealed the presence of Y-DNA N in India. Haplogroup N1-LLY22g was found in Brahmins from Gujarat, Madhya Pradesh and Mahastra (3.13%, 2.38% and 3.33% respectively), as well as tribal populations from Uttar Pradesh (1.56%). Their results were extended to include greater caste differentiation (Brahmins vs. Scheduled Castes vs. Tribals); here, Brahmins were found to have five times greater the frequency of N1-LLY22g than tribal groups (0.5% vs. 0.1% respectively).  [1]

Although the frequencies were arguably insignificant, the inference stood - Y-DNA Haplogroup N showed an association with the upper caste practitioners of Hinduism in India, paving the way for the scenario described in the above chapter to be considered.

However, the strength of this conclusion is weakened greatly by cross-sectional data from numerous studies concerning the Indian Subcontinent produced in the past decade:


  • Sengupta et al. (2006) revealed that, out of 1090 samples, with the majority coming from the Indian Subcontinent, the only populations revealing any Haplogroup N (N-M231) and associated downstream subclades were either East Asian (Chinese ethnicities, Cambodian) or Siberian (Yakut). [3] No groups from India belonged to Haplogroup N-M231.
  • Furthermore, Sahoo et al. (2006) also sampled individuals from across the Indian Subcontinent (n=1074) and failed to find a single instance of N-M231. [4]
  • In a recent study on various populations in Tamil Nadu (South India), Haplogroup N was completely absent in the 1680 samples tested. [5]
  • Y-DNA N1c-Tat was absent in the 607 tribal populations tested from East and Northeast India. [6]
  • Returning to the north of the country, 560 men from various upper castes and Muslim groups were tested by Zhao et al. and N1c-Tat was absent from all. [7] 
  • Focused specifically on Brahmins from Saraswat (Jammu-Kashmir), Yadav et al. found none of the approximately 109 haplotypes to belong to any derivative of Haplogroup N. [8]

Finally, the N Y-DNA Haplogroup Project at FTDNA currently does not show any samples whatsoever from the Indian Subcontinent.


Possible Explanation

Despite over 4,000 samples over five studies representing various groups from across India, not a single trace of Haplogroup N has been detected. What explains this glaring discrepancy with Sharma et al.'s findings? Differences in sampling strategy between the other studies with Sharma et al. cannot account for this; there is enough regional overlap to rule this out.

As was the case with Sengupta et al. where several Hazara haplogroup classifications were allegedly due to a laboratory error, it is probable the Haplogroup N seen here follows the same suit. By reasonable deduction, if one study reveals a trend that several others covering thousands of samples cannot verify, there must be something intrinsically erroneous in the former.


Conclusion

Until I can physically view the purported Haplogroup N haplotypes reported in Sharma et al., it is the conclusion of this entry that they are most likely the result of a laboratory error given the complete absence of any flavour of N-M231 in India through other recent studies. If any Haplogroup N is found, it must be contrasted against Sharma et al. and should be investigated on a separate line of inquiry. As ever, details of any future cases of Haplogroup N in India should be taken into consideration. If of a Mughal background, the paternal origins are readily explained by Medieval Central Asian ancestry. If from the furthest northeast of the Indian Subcontinent, the possibility of Nepali ancestry should be sought. [9] Although prehistoric indirect influence from Finno-Ugric interactions in the second millennium BC onwards shouldn't be dismissed outright, other more recent explanations exist.


References


1. Sharma S, Rai E, Sharma P, Jena M, Singh S, Darvishi K. The Indian origin of paternal haplogroup R1a1* substantiates the autochthonous origin of Brahmins and the caste system. J Hum Genet. 2009 Jan;54(1):47-55. doi: 10.1038/jhg.2008.2. Epub 2009 Jan 9.

2. Kuz'mina EE. The Origin of the Indo-Iranians. Koninklijke Brill NV, Leiden, The Netherlands. 2007.

3. Sengupta S, Zhivotovsky LA, King R, Mehdi SQ, Edmonds CA, Chow CE. Polarity and temporality of high-resolution y-chromosome distributions in India identify both indigenous and exogenous expansions and reveal minor genetic influence of Central Asian pastoralists. Am J Hum Genet. 2006 Feb;78(2):202-21. Epub 2005 Dec 16.

4. Sahoo S, Singh A, Himabindu G, Banerjee J, Sitalaximi T, Gaikwad S. A prehistory of Indian Y chromosomes: evaluating demic diffusion scenarios. Proc Natl Acad Sci U S A. 2006 Jan 24;103(4):843-8. Epub 2006 Jan 13.

5. Arunkumar G, Soria-Hernanz DF, Kavitha VJ, Arun VS, Syama A, Ashokan KS. Population differentiation of southern Indian male lineages correlates with agricultural expansions predating the caste system. PLoS One. 2012;7(11):e50269. doi: 10.1371/journal.pone.0050269. Epub 2012 Nov 28.

6. Borkar M, Ahmad F, Khan F, Agrawal S. Paleolithic spread of Y-chromosomal lineage of tribes in eastern and northeastern India. Ann Hum Biol. 2011 Nov;38(6):736-46. doi: 10.3109/03014460.2011.617389. Epub 2011 Oct 6.

7. Zhao Z, Khan F, Borkar M, Herrera R, Agrawal S. Presence of three different paternal lineages among North Indians: a study of 560 Y chromosomes. Ann Hum Biol. 2009 Jan-Feb;36(1):46-59. doi: 10.1080/03014460802558522.

8. Yadav B, Raina A, Dogra TD. Genetic polymorphisms for 17 Y-chromosomal STR haplotypes in Jammu and Kashmir Saraswat Brahmin population. Leg Med (Tokyo). 2010 Sep;12(5):249-55. doi: 10.1016/j.legalmed.2010.05.003.

9. Gayden T, Chennakrishnaiah S, La Salvia J, Jimenez S, Regueiro M, Maloney T. Y-STR diversity in the Himalayas. Int J Legal Med. 2011 May;125(3):367-75. doi: 10.1007/s00414-010-0485-x. Epub 2010 Jul 21.

Saturday, August 4, 2012

West Asian Y-DNA Haplogroup Q - Turkish or Autochthonous Origins? [Original Work]

Genographic Project Y-DNA Q Migration Route

Introduction
Y-DNA Haplogroup Q is defined by the M242 marker and is upstream to Haplogroup P-M45, making it the sister Haplogroup of R-M207, which populates much of West Eurasia. According to the Genographic Project, Haplogroup Q-M242 is between 15-20,000 years old, with the location invariably being placed around North Eurasia.

The frequency of Haplogroup Q largely matches the migration path outlined in the maps shown opposite. However, the presence of haplogroup Q in more southwestern portions of Asia has sparked the curiosity of genealogists and observers alike. In current literature, the presence of Haplogroup Q1a2-M25 specifically in Iran is cited as "Central Asian" influence. [1]

In an attempt to conclusively uncover the origins of Haplogroup Q-M242 in West Asia, the Y-STR haplotype variation of West, Central and South Asian Q1a-MEH2 and Q1b-M378 are visualised and analysed with genealogical tools.


Method
The data for this investigation are gathered from various Family Tree DNA (FTDNA) projects and studies, [1,2,6-11] with the concise list shown in the References section below.

Only results presenting at least 16 Y-STR's were considered. Modifications were made as necessary on certain STR markers (particularly Y-GATA H4) to correct nomenclature differences. Urasin's YPredictor was used when Y-SNP information from studies were inadequate (e.g. no SNP's upstream of Q-M242 tested).

Samples follow a constant naming convention, with _n and _yQP_n suffixes indicating they were obtained from studies and FTDNA Projects respectively. The following populations were included;

FTDNA Y-DNA Q Migration Route
Irn = Iranian (Unspecified ethnicity), Azr_Tal = Talysh from the Republic of Azerbaijan, Trk/Tur = Anatolian Turkish, Ptn = Pashtun from Afghanistan, Ind = Indian (Unspecified ethnicity/caste), Irq = Iraqi (Unspecified ethnicity), Kzk = Kazakh, Pak = Pakistani (Unspecified ethnicity), Uzb = Uzbek, Tjk = Tajik, Haz = Hazara, Npl = Nepali, Arm = Armenian, Geo = Georgian, UAE = Emirati Arab, Irn_Arab = Iranian Arab (Khuzestan), Irn_Mzn = Iranian Mazandarani (Mazandaran), Irn_Bkt = Iranian Bakhtiari

Once collation was complete, modal haplotypes of inferred clusters were found if necessary. Additionally, clusters were inferred from haplotrees that were created. The Most Recent Common Ancestor (tMRCA) of choice clusters were calculated by comparing two modals from the first pair of intra-cluster branches. Due to the STR panels tested in the concerned papers (Y-Filer order 1) McGee's Y-Utility was the only immediately viable choice (infinite allele mutation model, 75% Probability, 25 year/generation).


Working Hypothesis
An indeterminable mix of recent (>1500ybp) and prehistoric Y-DNA Q1a-MEH2 and Q1b-M378 lines exist in the region with some instances of close haplotype sharing between West, South and Central Asia.


Limitations Of This Investigation
  • Although the number of STR panels tested has increased gradually over the past decade, 16 is not considered a "confident sell" in the genealogy world. 
  • Additionally, the difference in STR panels used meant some informative populations, such as the Makrani, Baloch, Burusho and Parsis of Pakistan were not included due to an overlap of only 12 STR's.
  • Y-STR's from several crucial populations, such as the Qashqai, Iraqi Turkoman and Azeri's from the Republic of Azerbaijan could not be found.
  • There is, of course, the great debate concerning STR mutation rates. At the time of writing I have not observed any clear consensus in the genealogy regarding this topic. The applicability of Nordtvedt's Generations series to this entry is minimal due to an STR overlap issue, hence the decision to use McGee's tool instead.
  • As discussed later, the number of Y-SNP's tested across the cited studies are insufficient to draw firm conclusions.
  • Finally, sample size is an issue. The dataset is dominated by Iranian or Afghan samples because these papers were released at times (i.e. 2008-present) where the 17 STR Y-Filer panels became mainstream. 

Y-DNA Q1a Phylogenetic Tree
Haplogroup Q1a STR Results
Four informative clusters were inferred;

  • Cluster A (DYS19=15, DYS389i=12) is largely restricted to Afghan Pashtuns, with Ptn_1-4 all sharing having a MRCA with their modal (and therefore likely founding haplotype) between 900-450 ybp. This result is consistent with the dominance of Turkic-speaking dynasties in this time period. 
  • Cluster B (DYS385a=14) has a large geographical spread from Turkey through to Iran, the United Arab Emirates, Afghanistan, Nepal and Kazakhstan. The most immediate observation is the close haplotype sharing (3-step mutation, 14/17) between Kzk_1 and Irn_4, with an estimated MRCA at 900 ybp. This result, together with the general area covered, again indicates this cluster should at the very least be broadly associated with Central Asian Turks.
  • Cluster C (DYS392=16, DYS389ii=28, DYS448=22) is interesting because its' members are exclusively Iranian and belong to Haber et al.'s Influences of history, geography, and religion on genetic structure: the Maronites in Lebanon. [2] Most of the Iranians bearing Haplogroup Q-M242 in their sample were from West Iran, where Iran's Azeri population happens to dominate the northern region. The regional exclusivity of this cluster combined with the very recent MRCA (900 ybp) lead me to suspect Haber and his associates sampled a locale in West Iran that underwent genetic drift, explaining the +10% Q-M242 that is otherwise not seen in other studies. [1] However, the MRCA too suggests these Iranian men's paternal ancestor was also associated with Medieval Turks despite the result in it's entirety not representing West Iran sufficiently.
  • Cluster D (DYS439=11, DYS437=15) mirrors Cluster B's distribution across the region but the divisions are more consistent with geography than other variables (i.e. Anatolian Turk and Armenian, Hazara together). 


Haplogroup Q1b STR Results
Five informative clusters were inferred;

Y-DNA Q1b Phylogenetic Tree
  • Cluster A (DYS385a=12, DYS439=11, DYS437=15) is, relative to the others, an early offshoot that is highly localised in South-Central Asia. 
  • Cluster B (DYS385a=14) is also localised, found specifically in Iraq and Iran.
  • Cluster C (DYS385a=14, DYS448=20) is twinned with B but appears to have a younger MRCA (925 ybp). Of interest is the wide geographic distribution across Turkey, Iran, India and Kazakhstan. Central Asian Turks once more provide a convenient historical narrative for both the predicted MRCA and spread.
  • Cluster D (DYS385a=15) is again geographically localised, this time in the greater Near-East (Turkey, Iran and Syria). 
  • Cluster E (DYS385a=12, DYS437=15) once more displays geographic localisation in South-Central Asia, specifically among Afghani Pashtuns and a FTDNA Project Pakistani.


SNP's - What Do They Tell Us?
Tabulated Y-DNA Q SNP's for select populations from several studies [1, 3-5] can be viewed in the Vaêdhya Data Sink.

There is, unfortunately, a two-pronged incompatibility issue between the Y-STR analysis and Y-SNP's provided here. Not only is there poor overlap between the populations covered in both sets, but the SNP selections in the four studies cannot do not provide us with a clear picture regarding the presence of Q*-M242(xQ1a-MEH2,xQ1b-M378) Q1a*-MEH2(xQ1a2-M25), Q1a2-M25 and Q1b-M378.

However, the distribution of Q1a3-M346 and Q1b-M378 across the Iranian plateau in contrast with the specificity of Q1a2-M25 in Azeri Iranians and Turkmen (1.6% and 42.6% respectively, although the latter is likely due to genetic drift as discussed here) suggests a strain of the first two lineages is linguistically neutral and preceded the millennia of Turkish dynastic dominance in Iran.

Fortunately, such an inference is indeed supported by the Q1a and Q1b phylogenetic trees shown in this entry. One will note (particularly with Q1b-M378) the distribution is largely geographical rather than covering large swathes of Asian land through a "recent" paternal ancestor.


A comment on Assyrian Q-M242
Although the number of STR markers tested do not allow their inclusion into this research piece, I took the liberty of comparing the sole Assyrian Y-DNA Haplogroup Q-M242 individual from the FTDNA Assyrian Heritage DNA Project to elaborate on their paternal ancestor's ultimate origins.

The Assyrian people are a Neo-Aramaic-speaking ethnic minority native to the land intersecting between Turkey, Iran and Iraq as well as the Mesopotamian basin. Modern Assyrians have (due to their Christian faith and recent historical events) practiced endogamous relationships, making them a genetically distinct group minimally affected by demic movements in the surrounding populations.

The Assyrian Y-DNA Q belongs to the Q1b1a-L245 subclade. As we have observed already, haplogroup Q1b-M378 tends to have a distribution governed more by geography with deeper cluster branches, implying greater diversification time in a given region.

At present, based on the available 10 overlapping STR's, the Assyrian Q1b1a-L245 individual matches Tur_yQP_3 best with a one-step mutation (9/10), placing them deep within Cluster C, the only one without a region-specific distribution. This preliminary evaluation indicates this Assyrian man's paternal ancestor shares Medieval genetic links with Anatolian Turkish, Iranian, Indian and Kazakh men, making a Central Asian Turkish connection likely once more.


Conclusion
Due to the limitations described above, the identification of clusters is more relevant based on their geographic spread. The MRCA calculations shown are simply an extremely rough estimate at the age of a cluster.

However (and fortunately once more), it is very clear that some clusters are determined by geography rather than the sort of "genealogical boon" observed in a few (e.g. Q1a Cluster C's extensive branching despite being young relative to the others).

If one takes the MRCA calculations as a very rough approximation, whilst considering a cluster's ability to supercede regional boundaries, one can estimate that 75.4% (40/53) of the Y-DNA Haplogroup Q1a-MEH2 and 31.4% (11/35) of Y-DNA Haplogroup Q1b-M378 in West, Central and South Asia can be attributed to the Turkish migrations.

In summary, Y-DNA Haplogroup Q1a-MEH2 (likely Q1a2-M25 based on anecdotal SNP evidence) is a convincing Medieval Central Asian Turkish genetic marker based specifically on its' ability to form multi-ethnic clusters in regions with a historical Turkish connection. Q1b-M378, on the other hand, generally displays enough regionalisation and cluster depth to make such an association doubtful at best, with the sole exception being those who belong to the a genetic group highlighted in this entry (Cluster C) with DYS385a=14 and DYS448=20. 

South Central Asian Q1b-M378 appears to be autochthonous whereas any form of Q1a-MEH2 in the region has a strong association with regions intimately connected with the Medieval Turks. The Anatolian highlands and the Iranian plateau, however, appear to be a complicated mix between the two based on the lack of clear distinctions.

The slim presence of Haplogroup Q in India on the other hand, as far as the current data indicates, is almost entirely of Medieval Turkic input, although the Subcontinent's position as a geographic nexus (much like Iran and Turkey) certainly open the possibility for exotic para-haplogroups to also exist there.


Acknowledgement
  • Gratitude is extended to the FTDNA Projects for making their data publicly available. Independent research ventures such as my own would not be possible without their generosity.
  • I would also like to thank Mr. Paul Givargidze, administrator of the Assyrian Heritage, Aramaic and Y-DNA J1* DNA Projects at FTDNA for providing his esteemed support on this research entry.
  • The Y-DNA Haplogroup Q migration route maps are courtesy of the Genographic Project and FTDNA.

Addendum I [5/08/2012]: It has been brought to my attention that Tur_yQP_3, the Assyrian Q1b1a's best match, is in fact an Armenian individual. Although this does not compromise the conclusions reached above, it does serve as a reminder that not everyone in the Republic of Turkey is an ethnic Turk!
Addenum II [6/08/2012]: A recent exchange on a forum highlighted the likelihood of several Turk_yQP samples being Armenian rather than Anatolian Turkish. As above, the findings shouldn't impede too greatly on what has been discussed in this entry.


References
1. Grugni V, Battaglia V, Hooshiar Kashani B, Parolo S, Al-Zahery N, et al. (2012) Ancient Migratory Events in the Middle East: New Clues from the Y-Chromosome Variation of Modern Iranians. PLoS ONE 7(7): e41252. doi:10.1371/journal.pone.

2. Haber M, Platt DE, Badro DA, Xue Y, El-Sibai M, Bonab MA, Youhanna SC, Saade S, Soria-Hernanz DF, Royyuru A, Wells RS, Tyler-Smith C, Zalloua PA; Genographic Consortium. Influences of history, geography, and religion on genetic structure: the Maronites in Lebanon. Eur J Hum Genet. 2011 Mar;19(3):334-40. Epub 2010 Dec 1.

3. Al-Zahery N, Semino O, Benuzzi G, Magri C, Passarino G, Torroni A, Santachiara-Benerecetti AS. Y-chromosome and mtDNA polymorphisms in Iraq, a crossroad of the early human dispersal and of post-Neolithic migrations. Mol Phylogenet Evol. 2003 Sep;28(3):458-72.

4. Abu-Amero KK, Hellani A, González AM, Larruga JM, Cabrera VM, Underhill PA. Saudi Arabian Y-Chromosome diversity and its relationship with nearby regions. BMC Genet. 2009 Sep 22;10:59.

5. Cinnioğlu C, King R, Kivisild T, Kalfoğlu E, Atasoy S, Cavalleri GL, Lillie AS, Roseman CC, Lin AA, Prince K, Oefner PJ, Shen P, Semino O, Cavalli-Sforza LL, Underhill PA. Excavating Y-chromosome haplotype strata in Anatolia. Hum Genet. 2004 Jan;114(2):127-48. Epub 2003 Oct 29.

6. Gokcumen Ö, Gultekin T, Alakoc YD, Tug A, Gulec E, Schurr TG. Biological ancestries, kinship connections, and projected identities in four central Anatolian settlements: insights from culturally contextualized genetic anthropology. Am Anthropol. 2011;113(1):116-31.

7. Roewer L, Willuweit S, Stoneking M, Nasidze I. A Y-STR database of Iranian and Azerbaijanian minority populations. Forensic Sci Int Genet. 2009 Dec;4(1):e53-5. Epub 2009 Jun 5.

8. Dulik MC, Osipova LP, Schurr TG. Y-chromosome variation in Altaian Kazakhs reveals a common paternal gene pool for Kazakhs and the influence of Mongolian expansions. PLoS One. 2011 Mar 11;6(3):e17548.

9. Haber M, Platt DE, Ashrafian Bonab M, Youhanna SC, Soria-Hernanz DF, et al. (2012) Afghanistan's Ethnic Groups Share a Y-Chromosomal Heritage Structured by Historical Events. PLoS ONE 7(3): e34288. doi:10.1371/journal.pone.0034288

10. Tenzin Gayden, Alicia M. Cadenas, Maria Regueiro, Nanda B. Singh, Lev A. Zhivotovsky, Peter A. Underhill, Luigi L. Cavalli-Sforza, and Rene J. Herrera. The Himalayas as a Directional Barrier to Gene Flow. Am J Hum Genet. 2007 May; 80(5): 884–894.

11. Lacau H, Bukhari A, Gayden T, La Salvia J, Regueiro M, Stojkovic O, Herrera RJ. Y-STR profiling in two Afghanistan populations. Leg Med (Tokyo). 2011 Mar;13(2):103-8. Epub 2011 Jan 14.