Showing posts with label Iran. Show all posts

Thursday, July 9, 2015

Presenting Bakhtiari Uniparental Marker Data [Original Work]

Introduction
Bakhtiari people (Google Search)
The Bakhtiari people are one of Iran's ethnic minorities. Inhabiting the Iranian plateau's southwestern portion, the Bakhtiari traditionally maintained a hierarchical social structure with a genealogical basis (with organisations or positions including rish safids, kalantars, khans and ilkhani) [1]. Historically, the Bakhtiari have played a role in several pivotal events leading up to the formation of the modern Iranian state [2].

In recent years, the Bakhtiaris have received additional attention in the literature with respect to ancestry. This has been achieved predominantly via uniparental markers (Y-DNA and mtDNA) and coincides with work addressing the genetic origins of other ethnic minorities in Iran. For instance, in 2012, Grugni et al. expanded our understanding of Iranian Y-DNA across the country through sampling almost 1,000 unrelated men across 15 distinct ethnic groups (previous entry).

In spite of such developments, however, the Bakhtiari have not received much attention in either the genetic genealogy community or the literature. This entry attempts to explore the available data and arrive at a stable set of results for this group.

Method
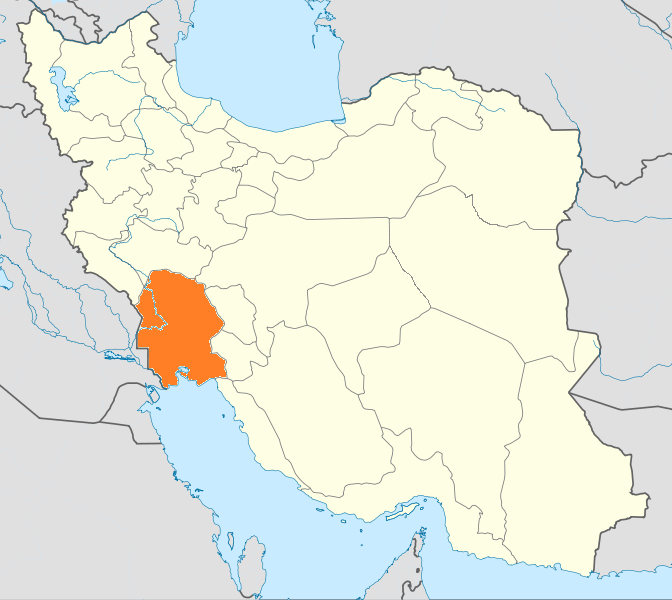
Khuzestan province, Iran (Wikipedia)

Search engines were limited to PubMed and Google Translate. Search terms included "Bakhtiari", "Y-DNA", "Y-Chromosome", "mtDNA", "mitochondrial", "STR", "SNP", "HVR" and "Iran". No limit was placed on publication date. All mtDNA and Y-DNA data was compiled. Where Y-STRs are presented, these were run through Vadim Urasin's YPredictor (v1.0.3 offline version). A 70% prediction strength threshold was implemented. If the resulting data is sparse, novel ways of consolidating the information will have to be devised and explained during the course of this entry.

Search Outcomes
Three studies were found to contain Bakhtiari uniparental data, with one partially covering Bakhtiari mtDNA (Derenko et al. 2013 [3]) and two for Y-DNA (Nasidze et al. 2008 [4], Roewer et al. 2009 [5]). The Bakhtiari populations featured mostly reside in Izeh, Khuzestan province, Iran [3-5] with a single sample coming from Lurestan province, Iran [4].

mtDNA Results
Derenko et al. featured only two Bakhtiari samples. One belonged to mtDNA H*, which was also observed in several Persian (Kerman province) and Qashqai samples, alongside a single Armenian. [3] The only other sample was mtDNA U2d2, also found in a single Persian (Kerman province). The authors noted that the combined frequency of mtDNA's U2c and U2d in Iran were highest among the Persians nationwide (approaching 10%) [3]. However, given the absence of additional samples, no reasonable conclusions can be drawn from these results.

Nasidze et al. provides both frequency and HVR1 derived variance data on the Bakhtiari and Ahwazi Arab populations [4]. The Bakhtiari appear to chiefly belong to mtDNA haplogroups N, U, H, T and J (below).

mtDNA Frequency Data from Khuzestan province, Iran {Nasidze et al. 2008)

Unfortunately, further information on subclade breakdown is not provided. However, as concluded by the authors and is evident through frequency data, the mtDNA profile of the Bakhtiari is almost identical to the Ahwazi Arab sample. Additionally, Nasidze et al. note "considerable sharing of HV[R]1 sequences" between these two groups [4]. In tandem with the inferences described above through Derenko et al., it appears that significant matrilineal marker overlap does exists across the Iranian plateau.

Y-DNA Results
Nasidze et al. first published data on 53 unrelated Bakhtiari men [4]. Due to substandard Y-SNP genotyping, the only conclusions that may broadly be discerned is the Bakhtiari chiefly belong to Y-DNA haplogroups J2-M172 (25%) and G-M201 (15%) (Data Sink). In this respect, these results cannot give observers a reliable indication of the Bakhtiari Y-DNA profile. Roewer et al.'s data indicates that some number of Bakhtiari do share the same core 17 STR haplotypes among one another (e.g. J2a4, T*)  but do not with any other samples across the country [5].

One "quick and dirty" way of addressing this problem is by using the YFiler (17 STR) Bakhtiari haplotypes (Data Sink) from Roewer et al. to "recharacterise" the Nasidze data. This is deemed the most suitable option for two reasons:
1) Nasidze et al. has an adequate sample size (n=53) but inadequate Y-SNP genotype selection
2) Roewer et al. has an inadequate sample size (n=18) and no confirmed Y-SNP testing, but the YPredictor data should provide reasonable subclade determination with a 70% probability threshold in place

"Recharacterisation" is achieved by expressing the Nasidze et al. data by the predicted subclade information provided by the Roewer et al. SNP predictions proportionally. For example, Nasidze et al. found "DE-YAP" at 8%, with the Roewer et al. predicted results showing 5.6% each for "DE*" and "E1b1b1". As both these subclades are contained within the DE-YAP node, the original value is recharacterised as DE 4% and E1b1b1 4%. The outcome is presented numerically (Data Sink) and demonstrated below (values rounded down to fit to 100%):


Y-DNA J2a4 constitutes the largest subclade (22.1%), with H (10.8%), R1a1a (8.9%) and T* (8.5%) following. The results imply considerable Y-SNP diversity within the Izeh Bakhtiari.

These results are somewhat at odds with that suggested by the Roewer et al. figures, particularly the frequency of Y-DNA J2-M172 (50% in Roewer et al. vs. 25% in Nasidze et al.). The most likely basis for this is sampling bias, given the former only tested for 18 individuals. It should be noted that Y-DNA J-12f2 has been documented to have a major (>60%) presence in Southwestern Iran (Quintana-Murci et al. 2001) with the majority of this likely being represented by downstream J2-M172 subclades (as per Grugni et al. 2012). It is therefore plausible for some Bakhtiari groups to yield exceptionally high frequencies of Y-DNA J2-M172 (likely J2a4 subclade) with future testing. The breakdown shown above is also broadly in line with past data from Southwestern Iran (Grugni et al. 2012).

It must be cautioned that literal interpretation of these results (both subclade breakdown and numbers) are not advised due to the inaccuracies brought by the "recharacterisation" and the lack of Y-SNP confirmation in Roewer et al.

It should also be emphasised that, as a tribal group, the Bakhtiari have most likely undergone genetic drift in their uniparental markers over time. As such, the finding of ~10% Y-DNA H is not completely surprising. Whether these values will be substantiated in future work is an open question.

Conclusion
The current evidence does suggest that the Bakhtiari closely resemble and share heritage with their immediate neighbours matrilineally, resting upon a backdrop of some common mtDNA diversity across the Iranian plateau. Inferences beyond this point will fall towards the realm of speculation.

The situation appears somewhat inverted on the Y-DNA side, where non-existent Y-STR haplotype sharing is observed with other groups in the Iranian plateau. The "recharacterised" data gives us an approximate idea of what the Bakhtiari Y-DNA profile should look like if Nasidze et al. used a better Y-SNP genotype panel.

Other ethnic minorities in Iran have received consistent attention in this respect, such as the neighbouring Qashqai and Lurs (Farjadian et al. 2011). The paucity in Bakhtiari uniparental marker data indicates this is very much an area that needs immediate attention. An initial first direction for researchers is to sample at least 50 unrelated individuals from Izeh using a more conventional Y-SNP genotype panel. Additional clarity will be gained by testing further areas, as well as reconciling the Bakhtiari tribal structure with these outcomes.

Acknowledgements
A very special thanks to the user "J Man" from Anthrogenica for bringing this interesting topic to my attention.

[Edit 10/07/2015]: I have also learned while researching this topic that Dr. Ivan Nasidze unfortunately passed away in 2012. His work served as an important early foundation towards understanding the genetic constitution of Caucasian and Iranian populations. May he rest in peace.

References
1. Bakhtiari. Last Accessed 25/06/2015: http://www.everyculture.com/Africa-Middle-East/Bakhtiari.html

2. Study of the Qajar government policy at the case of Household Bakhtiari. Last Accessed 6/07/2015: http://waliaj.com/wp-content/2014/Issue%201,%202014/26%202014-30-1-pp.124-127.pdf 

3. Derenko M, Malyarchuk B, Bahmanimehr A, Denisova G, Perkova M, Farjadian S. Complete mitochondrial DNA diversity in Iranians. PLoS One. 2013 Nov 14;8(11):e80673. doi: 10.1371/journal.pone.0080673. eCollection 2013.

4. Nasidze I, Quinque D, Rahmani M, Alemohamad SA, Stoneking M. Close genetic relationship between Semitic-speaking and Indo-European-speaking groups in Iran. Ann Hum Genet. 2008 Mar;72(Pt 2):241-52. doi: 10.1111/j.1469-1809.2007.00413.x. Epub 2008 Jan 20.

5. Roewer L, Willuweit S, Stoneking M, Nasidze I. A Y-STR database of Iranian and Azerbaijanian minority populations. Forensic Sci Int Genet. 2009 Dec;4(1):e53-5. doi: 10.1016/j.fsigen.2009.05.002. Epub 2009 Jun 5.

Saturday, July 13, 2013

A Hidden Gem in Central Asia: Previously Unknown Y-DNA R1b Haplotype [Original Work]

1. Introduction

Central Asian Y-DNA diversity has been an area of constant intrigue in the genetics community. Wells et
al.'s The Eurasian Heartland: A continental perspective on Y-chromosome diversity paved the way, with several others following in their regard. Members of the same team (including Dr. Wells) produced another paper - A Genetic Landscape Reshaped by Recent Events: Y-Chromosomal Insights into Central Asia - on the same topic in the following year, this time headed by Dr. Tatania Zerjal. I noted a greater emphasis on East-Central Asian populations as well as a mentioning of Y-STR analysis in the study itself. However, none of this data was supplied, with only Y-SNP information included (shown sporadically in this entry). The age of this paper is apparent through the nomenclature used (see Method section).

Several months ago, I made a request to obtain the Y-STR data from this study to one of the co-authors, Dr. Tyler-Smith, who kindly replied with the results of all sampled populations (Data Sink > Zerjal et al. Raw Data).

In this blog entry, the Y-STR data is showcased with a special emphasis on the Y-DNA R1b-M269 which was discovered.


2. Method
Y-SNP Phylogeny in original paper (Zerjal et al.) [1]


The maximum number of compatible Y-STR's were utilised for processing in Urasin's YPredictor for easier haplogroup identification (14 of a possible 16, DYS434 and 435 were excluded). All data was run through YPredictor. Only samples with ≥70% probability were included in the final results (Data Sink > Processed Data). As discussed below, relevant findings are compared with the basic Y-SNP haplogroups shown in the original study (on right).

One point which needs to be addressed immediately is the high frequency of "_DE-M1" and "P-M45". It appears that the STR selection has led to a phantom result, rendering many of the samples useless. For instance, the original study shows the Kazakhs belong overwhelmingly to C3c-M48, [1] although the probable results shown here are mostly "_DE-M1".  The exclusion of DYS434 and 435 from my level of processing likely contributed to this; if one assigns equal weight to the statistical strength of a prediction, removal of two STR's from a panel numbering 16, accuracy is reduced by 12.5%. Additionally, some conversion error seems to have applied with DYS437 (i.e. a value <12 is unusual). Therefore, "_DE-M1" and "P-M45" results were dismissed on account of the mismatch between predicted and likely confirmed haplogroups probably due to a compatibility issue between the study's STR panel and YPredictor..


3. Results

As the majority of samples were removed owing to the caveat described above, this entry will take a qualitative rather than quantitative approach to analysis on the general picture formed. Much of the remaining results are congruent with findings in other papers. Populations around the Caucasus are signified by plenty of R1b-M269, J2a-M410 and G2a-P15. Tajiks and the Kyrgyz were predominantly R1a1a-M17. Mongolians and other East-Central Asian ethnic groups yielded the most O3-M122 and "NO-M14" (likely to be Y-DNA N or O suffering from the STR restrictions described in the Method section).


Y-SNP distribution in Central Asia (Zerjal et al.) [1]


3i. The R1b Signal 

R1b-M269 was found across Central Asia and not only in the Caucasus (Armenians, Azeris, Georgians, Ossetians). It was mostly detected among the Turkmen (trk1, trk2, trk4, trk6, trk7, trk22, T29, T32) with a single sample among the Uzbek (uz-s110). [1]

Analysis of the haplotypes (including DYS434 and DYS435) revealed the nine Central Asian R1b samples belonged to a secure haplotype (Data Sink > R1b Results). trk6 diverged greatest, albeit with two 1-step mutations on DYS393 and DYS434. The rest match this haplotype exactly or have single 1-step mutations. [1] When this Central Asian R1b haplotype is compared with the other Caucasian samples, a mixed picture emerges, with the poorest being an Armenian (arm47) at 8/16, whereas the best are another Armenian (arm12) and Azeri (az48), both at 15/16. [1]
One interesting point is the Kurds sampled in this study (some of whom also belong to R1b-M269) are actually the displaced population positioned on the Iranian-Turkmenistani border. All of whom match the Central Asian R1b haplotype with a similar value (12-13/16). This definitively rules out the Kurds as a source for the haplotype, particularly as better matches can be found further to the west. It should be noted the Kurds themselves formed their own R1b haplotype (defined here by DYS389II=27, DYS391=10). [1]

In summary, the data reveals that the Turkmen are particularly abundant in R1b-M269 and all belong to the same haplotype as one of the Uzbek samples. This haplotype matched some Caucasians very well, but others not so well. The Kurds living in Turkmenistan belonged to their own haplotype.


3ii. Is This Actually R1b-M269?

Attention must first be shown to the original paper again; any potential R1b-M269 here will be present as P(xR1a)-92R7 (shown in the paper as "Haplogroup 1"). [1] Evidently, this makes up approximately half of the Turkmen lines and a quarter of Uzbek ones. Other haplogroups (such as other forms of R1b, R2a-M124, various Q subclades) presumably make up the rest of "Haplogroup 1" shown.

The next step is to verify whether or not this Central Asian R1b haplotype matches other R1b haplotypes online. As Y-DNA R1b-M269 is fortunately well-represented in the world of genetic genealogy, searching for the haplotype's matches on ySearch is a reasonable enterprise. DYS437 had to be excluded here due to a conversion issue, leaving the haplotype at 15 STR's. A genetic distance (GD) of 3 was allowed on these 15 markers. Results are shown on the right.

ySearch results for Central Asian R1b haplotype
With some confidence, the search has demonstrated that the Central Asian R1b haplotype does indeed belong to R1b-M269, as all the seven matches shown (one of whom is Armenian) belong to it.

Expanding the line of inquiry one further step came through comparing this haplotype with Iranian haplotypes [2] which were readily available. Due to differences in STR panels (an overlap of only 11) this proved to be inconclusive, aside from the observation that DYS389i+ii was completely different between the Central Asian modal (10-26) and the Iranian values. At this point I suspect that, much like DYS437, there is a conversion issue with DYS389 also.

Finally, a comparison was made with the R1b found in Afghanistan last year [3]. Interestingly, if DYS389i+ii and DYS437 are excluded, the two Uzbeks (samples 35 and 181) match the Central Asian R1b haplotype almost exactly based on the remaining 11 STR's. The one Tajik (sample 32) is less likely to be related due to two 1-step mutations on different STR's.


4. Conclusion

The inferences made from the data hang by a metaphorical thread due to the persistent STR issue; different labs have used different panels in the past decade, making it excruciatingly difficult to use materials from older papers. Fortunately, the presence of a specific strain of R1b-M269 in Central Asian (in Turkmen and Uzbeks) has successfully been demonstrated after select exclusions and no modifications to the data.

However, some larger questions remain. If STR limitations were not an issue, how would the Iranians from Haber et al. have compared? Would the Tajik from the other Haber et al. paper have belonged to the same haplotype in the end?

The origin of this Central Asian R1b haplotype will, I anticipate, also be a point discussed heavily among interested parties. At this point in time, I must stress that none of the evidence thus far points to anything in particular without ruling other theories out, although it leaves the door for interpretation wide open.

Having given this cautionary statement, the main thrust of this entry should be emphasised; R1b-M269 in Central Asia is a confirmed reality and here to stay. I will defer any subsequent analyses to the experts on Y-DNA R1b which grace several genetic genealogy boards for their take on the flavour of this haplotype.


5. Acknowledgement

I publicly extend my gratitude to Dr. Tyler-Smith for being so kind in sending me the raw STR's from this important paper for my research, as well as co-authoring the other two excellent studies I have cited here and in the past.


6. References

1. Zerjal T, Wells RS, Yuldasheva N, Ruzibakiev R, Tyler-Smith C. A genetic landscape reshaped by recent events: Y-chromosomal insights into central Asia. Am J Hum Genet. 2002 Sep;71(3):466-82. Epub 2002 Jul 17.

2. Haber M, Platt DE, Badro DA, Xue Y, El-Sibai M, Bonab MA. Influences of history, geography, and religion on genetic structure: the Maronites in Lebanon. Eur J Hum Genet. 2011 Mar;19(3):334-40. doi: 10.1038/ejhg.2010.177. Epub 2010 Dec 1.

3. Haber M, Platt DE, Ashrafian Bonab M, Youhanna SC, Soria-Hernanz DF, Martínez-Cruz B. Afghanistan's ethnic groups share a Y-chromosomal heritage structured by historical events. PLoS One. 2012;7(3):e34288. doi: 10.1371/journal.pone.0034288. Epub 2012 Mar 28.

Saturday, December 22, 2012

Yaghnobi Tajiks: Preliminary Results May Reveal Iranian Plateau Affinity [Original Work]

Slipping under the radar of the genetic genealogy world is this paper by Elisabetta Cilli and her colleagues, which investigated the mitochondrial data of 62 individuals from Tajikistan's Yaghnobi population. [1]

The Yaghnobis are of interest given their geographical isolation and the East Iranic nature of their language. Living just northeast of the predominantly Persian (Dari) speaking capital, Dushanbe, Yaghnobi is a continuation of a fully agglutinative Soghdian dialect representing the sole survivor of this language following the Persianization of Central Asia in Medieval times [2]. Despite its' East Iranic vocabulary, Yaghnobi demonstrates several linguistic features (i.e. gender loss, past imperfective preservation from present stem of a verb) which separates it from those modern East Iranic languages immediately surrounding it. Furthering the uniqueness of the Yaghnobi language in this context is the unity it forms through these features with languages mostly spoken further west in the Iranian plateau (e.g. Persian, Gilaki, Kurdish dialects). [2]

Although the results are preliminary and lack any empirical data, Cilli et al. have discovered some interesting connections between the Yaghnobi and relevant populations. In summary, they found the following:

MDS Plot of Results
  • 42 individuals used for the preliminary work belonged to only 19 distinct mtDNA haplotypes. Of these, 11 were distinct among the Yaghnobi.
  • The Yaghnobi have less mtDNA genetic diversity than other Central Asian populations (0.930) and this is attributed to their geographical isolation and recent history of displacement by the U.S.S.R. in the 1970's for agricultural purposes, where a small group (300) returned and repopulated their original homelands.
  • Intriguingly, the Yaghnobi shared all of the mutual haplotypes (8/19) with populations from Iran (e.g. Gilakis, Mazandaranis and Iranians from Tehran and Esfahan) instead of other Central Asian groups, including their Tajik compatriots.
  • The Yaghnobi shared most of these mutual haplotypes with Gilakis, Kurmanji Kurds and Avars from the Caucasus (4 each).
  • However, owing to their predominantly distinct mtDNA character, the Yaghnobi are clear outliers from the general zone occupied by the reference groups. 

My critique and interpretation of these results are as follows:

  • At least two instances of genetic drift occurring (founder effect via geographic isolation, bottleneck due to Soviet relocation) is likely responsible for the decreased mtDNA diversity. Thus, it is clearly simply a reflection of their environment.
  • As a result of the Soviet relocation, it may be useful to determine whether results from the displaced parent population match what has been stated here. This is quite possible given the relocations occurred just over one generation ago (~40 years).
  • It is difficult to criticise the decision to test 62 individuals and the utilisation of 42 haplotypes, given the Yaghnobi population in their homeland between 2007-9 only numbered approximately 500. Approximately 8% of the entire Yaghnobi population was therefore analysed here, which is a generous frequency given the amount of attention the region has received.
  • The MDS plot would have benefited from the inclusion of populations in Europe, Southwest Asia and South Asia to comprehensively flesh out the position of Yaghnobis in Eurasia.
  • Accepting that this is a preliminary investigation, it would still have been pleasing to see some raw data published. Aside from confirming that some/one Yaghnobi matched the Cambridge Reference Sequence (CRS, thus Haplogroup H2a2a which happened to be found in all the populations tested), there is no indication as to what the other mutations looked like. Or, for that matter, what mtDNA haplogroups were even present!


Correlation with Y-Chromosomal Data?

The Yaghnobi have been studied at least one other time through their inclusion in Dr. Spencer Wells et al.'s seminal piece The Eurasian heartland: a continental perspective on Y-chromosome diversity. The breakdown of their Y-Chromosomal SNP data (n=31) is as follows: [3]

3% C-M130(xC3a3-M48)
32% J2-M172
Y-SNP clustering reveals Yaghnobis sit near SE Europe and the Near-East
3% K-M9(xO-M175, O3-M122, O1a-M119, O2a1-M95, N1c1-M46) (possibly parahaplogroup such as K*-M9)
10% L-M20
3% P-M45 (xQ1a1-M120, Q1a3a1-M3, R2a-M124)
32% R1-M173 (likely R1b1a1-M73 or R1b1a2-M269)
16% R1a1a-M17(xR1a-M87, private marker)

Despite the double genetic drift undoubtedly affecting the frequencies, it is worth pointing out that the Yaghnobi presented with a broadly similar Y-DNA spectrum as Iran, where J2-M172, L-M20, R1-M173 and R1a1a-M17 (including subclades) comprise approximately 53% of the national average (refer to Grugni et al. analysis). 

This comparison should be taken with a grain of salt given the Iranian national average also comprises non-Iranic-speaking ethnic groups, the Wells Yaghnobi data does not present with thorough downstream Y-SNP evidence, the sample size is contentious and at least two contributors of a founder effect exist. However, that the Yaghnobi appear rich in J2, L and R is certainly reminiscent of Iranic-speaking populations in the region.


Conclusions

The Yaghnobi are an exceedingly interesting population whose overall parental markers seem to support a connection with populations further west than one would anticipate.

Despite the misgivings of all the data concerning them to date, the mtDNA similarity does corroborate specific linguistic features between the Yaghnobi language with those in the Iranian plateau, such as Kurdish or Persian.

If the data holds up in future investigations, it certainly calls to question whether the proposed model of linguistic inheritance exclusively down the parental line (as represented by Y-DNA data) is entirely correct given this connection.

How the Yaghnobi came to display the markers within them whilst speaking an East Iranic dialect with traits akin to those found in West Iranic languages is an intriguing question. One possible scenario is that the Yaghnobi are partly descended from ancient Iranians from the Iranian plateau during the Achaemanid era. This would also account for the linguistic commonalities noted in current literature.

Time (with the assistance of more mtDNA, Y-DNA and auDNA) will help us understand what happened in Central Asia during the formative period that was the Indo-Iranian migrations.


Reference

1. Cilli E, Delaini P, Costazza B, Giacomello L, Panaino A, Gruppioni G. Ethno-anthropological and genetic study of the Yaghnobis;an isolated community in Central Asia. A preliminary study. J Anthropol Sci. 2011;89:189-94.

2. Windfuhr, G. The Iranian Languages. 1st ed. Routledge Language Family Series. 2009.

3. Wells RS, Yuldasheva N, Ruzibakiev R, Underhill PA, Evseeva I, Blue-Smith J. The Eurasian heartland: a continental perspective on Y-chromosome diversity. Proc Natl Acad Sci U S A. 28;98:10244-9. 2001.

Saturday, August 4, 2012

West Asian Y-DNA Haplogroup Q - Turkish or Autochthonous Origins? [Original Work]

Genographic Project Y-DNA Q Migration Route

Introduction
Y-DNA Haplogroup Q is defined by the M242 marker and is upstream to Haplogroup P-M45, making it the sister Haplogroup of R-M207, which populates much of West Eurasia. According to the Genographic Project, Haplogroup Q-M242 is between 15-20,000 years old, with the location invariably being placed around North Eurasia.

The frequency of Haplogroup Q largely matches the migration path outlined in the maps shown opposite. However, the presence of haplogroup Q in more southwestern portions of Asia has sparked the curiosity of genealogists and observers alike. In current literature, the presence of Haplogroup Q1a2-M25 specifically in Iran is cited as "Central Asian" influence. [1]

In an attempt to conclusively uncover the origins of Haplogroup Q-M242 in West Asia, the Y-STR haplotype variation of West, Central and South Asian Q1a-MEH2 and Q1b-M378 are visualised and analysed with genealogical tools.


Method
The data for this investigation are gathered from various Family Tree DNA (FTDNA) projects and studies, [1,2,6-11] with the concise list shown in the References section below.

Only results presenting at least 16 Y-STR's were considered. Modifications were made as necessary on certain STR markers (particularly Y-GATA H4) to correct nomenclature differences. Urasin's YPredictor was used when Y-SNP information from studies were inadequate (e.g. no SNP's upstream of Q-M242 tested).

Samples follow a constant naming convention, with _n and _yQP_n suffixes indicating they were obtained from studies and FTDNA Projects respectively. The following populations were included;

FTDNA Y-DNA Q Migration Route
Irn = Iranian (Unspecified ethnicity), Azr_Tal = Talysh from the Republic of Azerbaijan, Trk/Tur = Anatolian Turkish, Ptn = Pashtun from Afghanistan, Ind = Indian (Unspecified ethnicity/caste), Irq = Iraqi (Unspecified ethnicity), Kzk = Kazakh, Pak = Pakistani (Unspecified ethnicity), Uzb = Uzbek, Tjk = Tajik, Haz = Hazara, Npl = Nepali, Arm = Armenian, Geo = Georgian, UAE = Emirati Arab, Irn_Arab = Iranian Arab (Khuzestan), Irn_Mzn = Iranian Mazandarani (Mazandaran), Irn_Bkt = Iranian Bakhtiari

Once collation was complete, modal haplotypes of inferred clusters were found if necessary. Additionally, clusters were inferred from haplotrees that were created. The Most Recent Common Ancestor (tMRCA) of choice clusters were calculated by comparing two modals from the first pair of intra-cluster branches. Due to the STR panels tested in the concerned papers (Y-Filer order 1) McGee's Y-Utility was the only immediately viable choice (infinite allele mutation model, 75% Probability, 25 year/generation).


Working Hypothesis
An indeterminable mix of recent (>1500ybp) and prehistoric Y-DNA Q1a-MEH2 and Q1b-M378 lines exist in the region with some instances of close haplotype sharing between West, South and Central Asia.


Limitations Of This Investigation
  • Although the number of STR panels tested has increased gradually over the past decade, 16 is not considered a "confident sell" in the genealogy world. 
  • Additionally, the difference in STR panels used meant some informative populations, such as the Makrani, Baloch, Burusho and Parsis of Pakistan were not included due to an overlap of only 12 STR's.
  • Y-STR's from several crucial populations, such as the Qashqai, Iraqi Turkoman and Azeri's from the Republic of Azerbaijan could not be found.
  • There is, of course, the great debate concerning STR mutation rates. At the time of writing I have not observed any clear consensus in the genealogy regarding this topic. The applicability of Nordtvedt's Generations series to this entry is minimal due to an STR overlap issue, hence the decision to use McGee's tool instead.
  • As discussed later, the number of Y-SNP's tested across the cited studies are insufficient to draw firm conclusions.
  • Finally, sample size is an issue. The dataset is dominated by Iranian or Afghan samples because these papers were released at times (i.e. 2008-present) where the 17 STR Y-Filer panels became mainstream. 

Y-DNA Q1a Phylogenetic Tree
Haplogroup Q1a STR Results
Four informative clusters were inferred;

  • Cluster A (DYS19=15, DYS389i=12) is largely restricted to Afghan Pashtuns, with Ptn_1-4 all sharing having a MRCA with their modal (and therefore likely founding haplotype) between 900-450 ybp. This result is consistent with the dominance of Turkic-speaking dynasties in this time period. 
  • Cluster B (DYS385a=14) has a large geographical spread from Turkey through to Iran, the United Arab Emirates, Afghanistan, Nepal and Kazakhstan. The most immediate observation is the close haplotype sharing (3-step mutation, 14/17) between Kzk_1 and Irn_4, with an estimated MRCA at 900 ybp. This result, together with the general area covered, again indicates this cluster should at the very least be broadly associated with Central Asian Turks.
  • Cluster C (DYS392=16, DYS389ii=28, DYS448=22) is interesting because its' members are exclusively Iranian and belong to Haber et al.'s Influences of history, geography, and religion on genetic structure: the Maronites in Lebanon. [2] Most of the Iranians bearing Haplogroup Q-M242 in their sample were from West Iran, where Iran's Azeri population happens to dominate the northern region. The regional exclusivity of this cluster combined with the very recent MRCA (900 ybp) lead me to suspect Haber and his associates sampled a locale in West Iran that underwent genetic drift, explaining the +10% Q-M242 that is otherwise not seen in other studies. [1] However, the MRCA too suggests these Iranian men's paternal ancestor was also associated with Medieval Turks despite the result in it's entirety not representing West Iran sufficiently.
  • Cluster D (DYS439=11, DYS437=15) mirrors Cluster B's distribution across the region but the divisions are more consistent with geography than other variables (i.e. Anatolian Turk and Armenian, Hazara together). 


Haplogroup Q1b STR Results
Five informative clusters were inferred;

Y-DNA Q1b Phylogenetic Tree
  • Cluster A (DYS385a=12, DYS439=11, DYS437=15) is, relative to the others, an early offshoot that is highly localised in South-Central Asia. 
  • Cluster B (DYS385a=14) is also localised, found specifically in Iraq and Iran.
  • Cluster C (DYS385a=14, DYS448=20) is twinned with B but appears to have a younger MRCA (925 ybp). Of interest is the wide geographic distribution across Turkey, Iran, India and Kazakhstan. Central Asian Turks once more provide a convenient historical narrative for both the predicted MRCA and spread.
  • Cluster D (DYS385a=15) is again geographically localised, this time in the greater Near-East (Turkey, Iran and Syria). 
  • Cluster E (DYS385a=12, DYS437=15) once more displays geographic localisation in South-Central Asia, specifically among Afghani Pashtuns and a FTDNA Project Pakistani.


SNP's - What Do They Tell Us?
Tabulated Y-DNA Q SNP's for select populations from several studies [1, 3-5] can be viewed in the Vaêdhya Data Sink.

There is, unfortunately, a two-pronged incompatibility issue between the Y-STR analysis and Y-SNP's provided here. Not only is there poor overlap between the populations covered in both sets, but the SNP selections in the four studies cannot do not provide us with a clear picture regarding the presence of Q*-M242(xQ1a-MEH2,xQ1b-M378) Q1a*-MEH2(xQ1a2-M25), Q1a2-M25 and Q1b-M378.

However, the distribution of Q1a3-M346 and Q1b-M378 across the Iranian plateau in contrast with the specificity of Q1a2-M25 in Azeri Iranians and Turkmen (1.6% and 42.6% respectively, although the latter is likely due to genetic drift as discussed here) suggests a strain of the first two lineages is linguistically neutral and preceded the millennia of Turkish dynastic dominance in Iran.

Fortunately, such an inference is indeed supported by the Q1a and Q1b phylogenetic trees shown in this entry. One will note (particularly with Q1b-M378) the distribution is largely geographical rather than covering large swathes of Asian land through a "recent" paternal ancestor.


A comment on Assyrian Q-M242
Although the number of STR markers tested do not allow their inclusion into this research piece, I took the liberty of comparing the sole Assyrian Y-DNA Haplogroup Q-M242 individual from the FTDNA Assyrian Heritage DNA Project to elaborate on their paternal ancestor's ultimate origins.

The Assyrian people are a Neo-Aramaic-speaking ethnic minority native to the land intersecting between Turkey, Iran and Iraq as well as the Mesopotamian basin. Modern Assyrians have (due to their Christian faith and recent historical events) practiced endogamous relationships, making them a genetically distinct group minimally affected by demic movements in the surrounding populations.

The Assyrian Y-DNA Q belongs to the Q1b1a-L245 subclade. As we have observed already, haplogroup Q1b-M378 tends to have a distribution governed more by geography with deeper cluster branches, implying greater diversification time in a given region.

At present, based on the available 10 overlapping STR's, the Assyrian Q1b1a-L245 individual matches Tur_yQP_3 best with a one-step mutation (9/10), placing them deep within Cluster C, the only one without a region-specific distribution. This preliminary evaluation indicates this Assyrian man's paternal ancestor shares Medieval genetic links with Anatolian Turkish, Iranian, Indian and Kazakh men, making a Central Asian Turkish connection likely once more.


Conclusion
Due to the limitations described above, the identification of clusters is more relevant based on their geographic spread. The MRCA calculations shown are simply an extremely rough estimate at the age of a cluster.

However (and fortunately once more), it is very clear that some clusters are determined by geography rather than the sort of "genealogical boon" observed in a few (e.g. Q1a Cluster C's extensive branching despite being young relative to the others).

If one takes the MRCA calculations as a very rough approximation, whilst considering a cluster's ability to supercede regional boundaries, one can estimate that 75.4% (40/53) of the Y-DNA Haplogroup Q1a-MEH2 and 31.4% (11/35) of Y-DNA Haplogroup Q1b-M378 in West, Central and South Asia can be attributed to the Turkish migrations.

In summary, Y-DNA Haplogroup Q1a-MEH2 (likely Q1a2-M25 based on anecdotal SNP evidence) is a convincing Medieval Central Asian Turkish genetic marker based specifically on its' ability to form multi-ethnic clusters in regions with a historical Turkish connection. Q1b-M378, on the other hand, generally displays enough regionalisation and cluster depth to make such an association doubtful at best, with the sole exception being those who belong to the a genetic group highlighted in this entry (Cluster C) with DYS385a=14 and DYS448=20. 

South Central Asian Q1b-M378 appears to be autochthonous whereas any form of Q1a-MEH2 in the region has a strong association with regions intimately connected with the Medieval Turks. The Anatolian highlands and the Iranian plateau, however, appear to be a complicated mix between the two based on the lack of clear distinctions.

The slim presence of Haplogroup Q in India on the other hand, as far as the current data indicates, is almost entirely of Medieval Turkic input, although the Subcontinent's position as a geographic nexus (much like Iran and Turkey) certainly open the possibility for exotic para-haplogroups to also exist there.


Acknowledgement
  • Gratitude is extended to the FTDNA Projects for making their data publicly available. Independent research ventures such as my own would not be possible without their generosity.
  • I would also like to thank Mr. Paul Givargidze, administrator of the Assyrian Heritage, Aramaic and Y-DNA J1* DNA Projects at FTDNA for providing his esteemed support on this research entry.
  • The Y-DNA Haplogroup Q migration route maps are courtesy of the Genographic Project and FTDNA.

Addendum I [5/08/2012]: It has been brought to my attention that Tur_yQP_3, the Assyrian Q1b1a's best match, is in fact an Armenian individual. Although this does not compromise the conclusions reached above, it does serve as a reminder that not everyone in the Republic of Turkey is an ethnic Turk!
Addenum II [6/08/2012]: A recent exchange on a forum highlighted the likelihood of several Turk_yQP samples being Armenian rather than Anatolian Turkish. As above, the findings shouldn't impede too greatly on what has been discussed in this entry.


References
1. Grugni V, Battaglia V, Hooshiar Kashani B, Parolo S, Al-Zahery N, et al. (2012) Ancient Migratory Events in the Middle East: New Clues from the Y-Chromosome Variation of Modern Iranians. PLoS ONE 7(7): e41252. doi:10.1371/journal.pone.

2. Haber M, Platt DE, Badro DA, Xue Y, El-Sibai M, Bonab MA, Youhanna SC, Saade S, Soria-Hernanz DF, Royyuru A, Wells RS, Tyler-Smith C, Zalloua PA; Genographic Consortium. Influences of history, geography, and religion on genetic structure: the Maronites in Lebanon. Eur J Hum Genet. 2011 Mar;19(3):334-40. Epub 2010 Dec 1.

3. Al-Zahery N, Semino O, Benuzzi G, Magri C, Passarino G, Torroni A, Santachiara-Benerecetti AS. Y-chromosome and mtDNA polymorphisms in Iraq, a crossroad of the early human dispersal and of post-Neolithic migrations. Mol Phylogenet Evol. 2003 Sep;28(3):458-72.

4. Abu-Amero KK, Hellani A, González AM, Larruga JM, Cabrera VM, Underhill PA. Saudi Arabian Y-Chromosome diversity and its relationship with nearby regions. BMC Genet. 2009 Sep 22;10:59.

5. Cinnioğlu C, King R, Kivisild T, Kalfoğlu E, Atasoy S, Cavalleri GL, Lillie AS, Roseman CC, Lin AA, Prince K, Oefner PJ, Shen P, Semino O, Cavalli-Sforza LL, Underhill PA. Excavating Y-chromosome haplotype strata in Anatolia. Hum Genet. 2004 Jan;114(2):127-48. Epub 2003 Oct 29.

6. Gokcumen Ö, Gultekin T, Alakoc YD, Tug A, Gulec E, Schurr TG. Biological ancestries, kinship connections, and projected identities in four central Anatolian settlements: insights from culturally contextualized genetic anthropology. Am Anthropol. 2011;113(1):116-31.

7. Roewer L, Willuweit S, Stoneking M, Nasidze I. A Y-STR database of Iranian and Azerbaijanian minority populations. Forensic Sci Int Genet. 2009 Dec;4(1):e53-5. Epub 2009 Jun 5.

8. Dulik MC, Osipova LP, Schurr TG. Y-chromosome variation in Altaian Kazakhs reveals a common paternal gene pool for Kazakhs and the influence of Mongolian expansions. PLoS One. 2011 Mar 11;6(3):e17548.

9. Haber M, Platt DE, Ashrafian Bonab M, Youhanna SC, Soria-Hernanz DF, et al. (2012) Afghanistan's Ethnic Groups Share a Y-Chromosomal Heritage Structured by Historical Events. PLoS ONE 7(3): e34288. doi:10.1371/journal.pone.0034288

10. Tenzin Gayden, Alicia M. Cadenas, Maria Regueiro, Nanda B. Singh, Lev A. Zhivotovsky, Peter A. Underhill, Luigi L. Cavalli-Sforza, and Rene J. Herrera. The Himalayas as a Directional Barrier to Gene Flow. Am J Hum Genet. 2007 May; 80(5): 884–894.

11. Lacau H, Bukhari A, Gayden T, La Salvia J, Regueiro M, Stojkovic O, Herrera RJ. Y-STR profiling in two Afghanistan populations. Leg Med (Tokyo). 2011 Mar;13(2):103-8. Epub 2011 Jan 14.

Thursday, July 19, 2012

Interpreting New Iranian Y-Chromosomal Data (Grugni et al.) [Review]


Introduction


A new study on Iranian Y-Chromosomes released just yesterday has, to my satisfaction, adequately sampled every major ethno-linguistic group as well as determining inter-provincial variation between them. Grugni et al. sampled 938 unrelated Iranian men from 15 ethnic groups (including Assyrians, Zoroastrians and Turkmen) in 14 provinces across the country.


Abstract

"Knowledge of high resolution Y-chromosome haplogroup diversification within Iran provides important geographic context regarding the spread and compartmentalization of male lineages in the Middle East and southwestern Asia. At present, the Iranian population is characterized by an extraordinary mix of different ethnic groups speaking a variety of Indo-Iranian, Semitic and Turkic languages. Despite these features, only few studies have investigated the multiethnic components of the Iranian gene pool. In this survey 938 Iranian male DNAs belonging to 15 ethnic groups from 14 Iranian provinces were analyzed for 84 Y-chromosome biallelic markers and 10 STRs. The results show an autochthonous but non-homogeneous ancient background mainly composed by J2a sub-clades with different external contributions. The phylogeography of the main haplogroups allowed identifying post-glacial and Neolithic expansions toward western Eurasia but also recent movements towards the Iranian region from western Eurasia (R1b-L23), Central Asia (Q-M25), Asia Minor (J2a-M92) and southern Mesopotamia (J1-Page08). In spite of the presence of important geographic barriers (Zagros and Alborz mountain ranges, and the Dasht-e Kavir and Dash-e Lut deserts) which may have limited gene flow, AMOVA analysis revealed that language, in addition to geography, has played an important role in shaping the nowadays Iranian gene pool. Overall, this study provides a portrait of the Y-chromosomal variation in Iran, useful for depicting a more comprehensive history of the peoples of this area as well as for reconstructing ancient migration routes. In addition, our results evidence the important role of the Iranian plateau as source and recipient of gene flow between culturally and genetically distinct populations."

[PDF]


Interpretation of Results

Iranian Y-SNP Frequencies

Data from the original study can be found opposite. In addition, several contour maps showing the frequency of select Y-DNA Haplogroups found across the country are shown along the right. Armenians, Zoroastrians and Assyrians from Tehran, as well as Afro-Iranians from Hormozgan province, are excluded. Note that updated ISOGG nomenclature was applied wherever deemed appropriate (refer to SNP's for clarification of status). Frequency ranges shown on maps are from 0-100%. Please note the maps are only intended to depict general trends rather than specific figures. Refer to the figures from the study (above) for these.


- Consistent with anthropological data and historical records from South Iran, the Y-DNA Haplogroups with frequencies greater in Africa than Eurasia (B-M60 and E2-M75) peak in Hormozgan province. 

- Over half a dozen para-Haplogroups (C*-M216, F*-M89, H*-M69, IJ*-M429, J2*-M172, L*-M61, NO*-LLY22g, Q1*-P36.2 and R*-M207) were found scattered across Iran. Although the presence of para-Haplogroups within a region are often taken as an indicator of a lineage's antiquity there, both their consistency and correspondence with downstream younger clades must be considered before such a conclusion is made. As such, I do not consider H*-M69, NO*-LLY22g or C*-M216's presence in this cohort to indicate anything other than Iran's position as a geographic crossroad. The remaining ones (particularly J2*-M172, L*-M61 and R*-M207) require further investigation to elucidate whether Iran does stake the claim to the origins of each.

- Further to the above, it is likely that the R*-M207 reported in this paper is in fact R2*-M479 based on the dated SNP array used.

- C5-M356 makes a sporadic appearance across Iran. A mysterious clade with a spotty distribution across much of Eurasia. In the region, it is more commonly associated with the Indian Subcontinent.
Iranian J1c3-PAGE08

- Haplogroup G makes a strong appearance with, in my opinion, enough clade diversity to validate an origin in Iran or a close-by region. This is partially supported by its' presence in every ethnic group, albeit through different subclades.

- Although IJ*-M429 has finally been found, Grugni et al.'s decision not to publish STR data does not give us the means to determine if the two Mazandarani and Persian men are in fact related within a genealogical timeframe. The significance of this find in Iran will have to remain pending.

- The lacklustre SNP definition in the Y-DNA I found in Iran (Gilaki, Bandari, Kurdish and Armenian populations between I1-M253 and I2-M438) dissuades strong conclusions regarding the development of I-M170 relative to IJ*-M429's discovery. The lack of STR's prevents us from ascertaining whether these are recent contributions from Europe or not, or whether there is any European connection to begin with.

- Both the frequency and subclade diversity of Haplogroup J2-M172 (as well as the presence of J2*-M172 and J2a*-M410 across the country) makes Iran a strong candidate for the origin of this lineage.

- The strong presence of J1c3-PAGE08 is one of the surprising finds of this study. With an absence only amongst Assyrians from Azarbaijan province and a peak in Khuzestani Arabs (31.6%), I speculate this is an early Near-Eastern pastoralist nomad marker that is only accentuated in Khuzestani Arabs because the L147.1 marker (J1c3d), which is commonly associated with the expansion of Semitic languages (particularly Arabic in literature) was not tested here. Otherwise, it would be difficult to reconcile medieval Arabic admixture among Iran's Zoroastrians being comparable (and often greater) than Azeris, for instance, as Azerbaijan hosted Arab garrisons following the Sassanid collapse.

- Haplogroup Q presents with a very distorted picture. 42.6% of Turkmens belonging to Q1a2-M25 is not in agreement with Wells et al.'s The Eurasian Heartland: A continental perspective on Y-chromosome diversity, where Haplogroups J, N, R1a and R1b predominated, suggesting either an extensive Founder effect has taken place (i.e. regionalisation of certain branches from a common Oghuz Turk pool) or the Golestani Turkmen values have experienced a more generic form of genetic drift.
On the matter of Turkic affinities, Azeri's from Azarbaijan province have greater subclade variation than all other ethnic groups. However, the total frequency is either comparable (or less) than Persians nationwide. As it stands, if one were to presume Haplogroup Q in Iran was of Turkic origins, it would appear their contribution to the Persian and Azeri genepools is comparable despite linguistic differences. Although more data would certainly flesh this matter out, this diversity combined with the presence of N-M216 among Iran's Azeri population certainly gives a genetic basis for their linguistic heritage.

- Haplogroup R1a1a-M17 is regularly found at frequencies greater than 15% across Iran, contrary to the assertion made by Dr. Wells one decade ago regarding the limited samples he obtained, again from The Eurasian Heartland: A continental perspective on Y-chromosome diversity ;

Iranian G2a-P15
"Intriguingly, the population of present-day Iran, speaking a major Indo-European language (Farsi), appears to have had little genetic influence from the M17-carrying Indo-Iranians."

It is somewhat ironic, however, to note that the Persians from Fars province presented one of the lowest R1a1a-M17 frequencies observed in this study. Whether sampling chance is an issue here, or the sparsity of M17 is indeed a reality, is an open question.

- The presence of both R1a1-SRY1532.2 (shown as R1a* due to old nomenclature) and R1b*-M343 repeat the presence of these para-Haplogroups in the region, indicating West Asia was from whence Haplogroup R1-M173 began differentiating into the two primary subclades we see today in Eurasia.

- Haplogroup R1b1a2a-L23 is more frequent in the north and west of the country, which (together with its' presence in the furthest southern and eastern poles at ~3%) suggests it likely moved in an overall south-easterly direction via diffusion, probably during the Neolithic.

- The distribution of Haplogroup R2a-M124 is, much like C5-M356, irregular. Contrary to what is shown in Haber et al.'s research, R2a is not more common in the east of the country. Instead, it can be found amongst Esfahani Persians at a frequency of 9.1%. That Iran's R2a frequency achieves its' peak in the centre of the country is reminiscent of Sahoo et al.'s A prehistory of Indian Y chromosomes: Evaluating demic diffusion scenarios;


The sensationalist question of the hour; what accounts for the spike in R2a-M124 that has been picked up in Central Iran for the past half decade?

- Finally, Haplogroup T-M70 enjoys a frequency of 10.1% amongst Assyrians from Azarbaijan province, whilst also being more common among Persians across the country and Iranians from the western periphery of the country (Azeris and Kurds). This would suggest, therefore, an at least passive but deep association with ancient Near-Eastern cultures.

Criticisms of Paper

Despite the rich sampling pool, I have several immediate criticisms;

Iranian J1-M267
  • There are some issues with the sampling strategy employed by this paper. For instance, the Assyrians (Christian non-Arab Semitic-speaking minority) are represented by 39 men, although Persians from Esfahan (a major Iranian city) are by 11 only. 
  • Inadequate haplotype data has been released; the only offering is 8-STR's from select lineages (e.g. J1*-M267) which were used for variance analysis.
  • Furthermore, a maximum of 10 Y-STR's were analysed, rendering some of their variance calculations questionable at such a low resolution. This also does away with the possibility of MRCA and intra-subclade age calculations.
  • Grugni et al. have approached Haplogroup R1a1a-M17 in a similar vein to past studies (e.g. Haber et al., see Showcasing of Y-DNA Variation Among Afghan Ethnic Groups) by not referring to current data concerning the structure of R1a1a. As with Haber et al., R1a1a-M458 is taken as the "European" strain, despite research undertaken by the R1a1a and Subclades Y-DNA Project revealing the apparent schism between the upstream Z283 and Z93 SNP's being far more informative in this regard.
  • Haplogroup R1b1a2*-L23 is considered as a "West Eurasian" paternal contribution to the Iranian plateau rather than the possibility it may have originated within or in proximity to the country's western zone. 
  • As shown in Interpretation of Results, Grugni et al.'s use of dated nomenclature poses problems for those who may not be intimately familiar with recent Y-SNP Tree changes by ISOGG.

Acknowledgements

Map of Iran courtesy of D-Maps.com.